First of all, a few important notes that you should definitely pay attention to.

Fig: WiFi battery monitor
The WiFi battery monitor can be integrated into SignalK. The measurement data can then be displayed in the instrument panel. A small detour via MQTT is necessary for integration in SignalK. Since the WiFi battery monitor can also communicate with the Tasmota software via MQTT as standard, we use this interface in conjunction with the SignalK plug-in signal-mqtt-gw by Teppo Kurki. Basically, we don't need an MQTT server on the Raspi if we want to use the SignalK plugin. If an MQTT server is running on the Raspi, the port addresses must be changed to avoid conflicts. The SignalK plug-in behaves like an MQTT server and can interpret the telegrams sent, but without error handling and special transaction protection. The following shows how the configuration must be carried out.
WiFi battery monitor configuration
Under Configure MQTT the following settings are made:
- Host: IP of the Raspi is running on the SignalK
- Port: 1883 (change if an MQTT server should run on the Rapi)
- Client: PZEM-017 (name of the device that is displayed as source in MQTT)
- Topic: service
- Full Topic: battmonitor / service
Username and password remain unchanged and are not used.
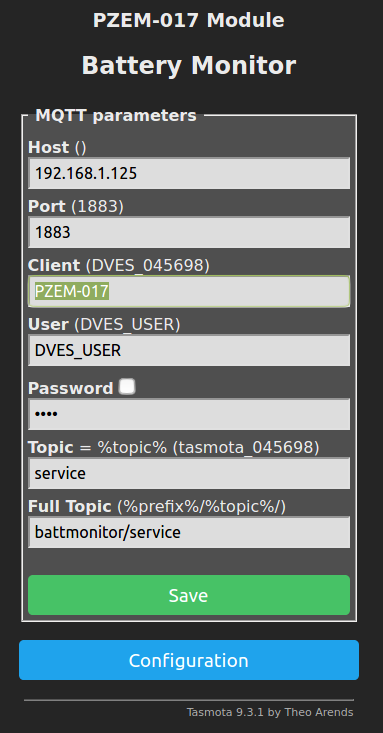
Fig: Configure MQTT
Then is still under Configure Other to check whether MQTT is activated.
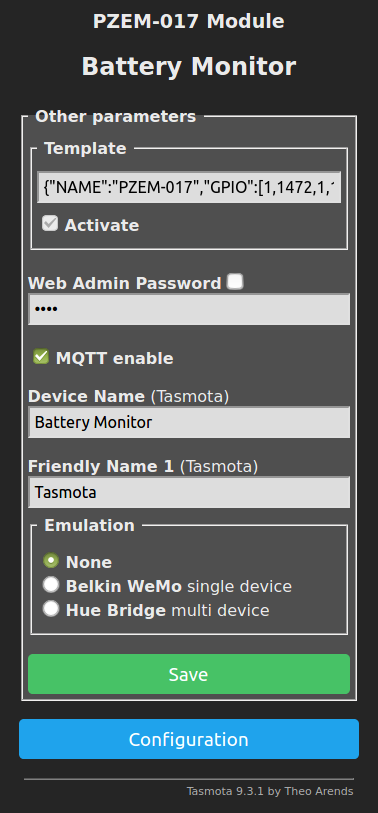
Fig: Configure Other
Under Configure logging the update rate is set with which the telegrams are to be sent. There is also the parameter Telemetry Period. The value is given in seconds. 10 can be used as the smallest value. Data transfers faster than 10s are not possible. The measurement data are then displayed in SignalK with this update rate.
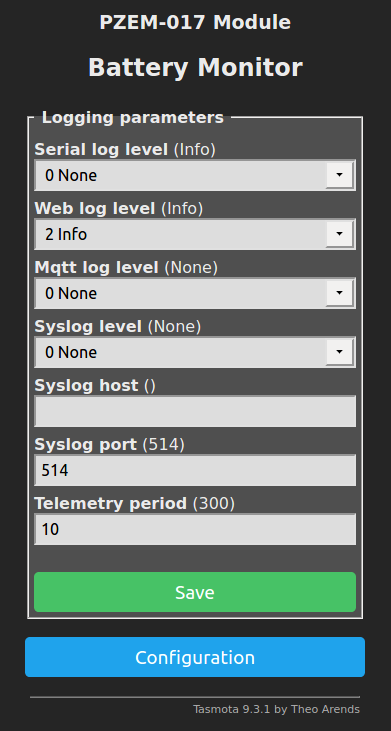
Fig: Configure logging
As a last step, we have to add two special rules to the Tasmota firmware that processes the data telegrams so that they can be used by the SignalK plug-in signal-mqtt-gw can be processed. Rules are Tasmota firmware extensions with which the behavior of Tasmota can be influenced. If you want to know more about how it works, you can do this here read in detail. The SignalK plug-in for MQTT always expects individual data pairs per telegram with an identifier and a measured value. The identifier corresponds to the data path in SignalK. The data paths should not be chosen arbitrarily and should adhere to the specifications for data paths. Details can be found in the SignalK documentation in the appendix under appendix A and B. Both rules split the original MQTT telegram into 8 individual MQTT partial telegrams as can also be seen in the logging.
18:07:37 MQT: battmonitor / service / SENSOR = {"Time": "2021-04-18T18: 07: 37", "ENERGY": {"TotalStartTime": "2021-04-09T17: 21:15" , "Total": 0.122, "Yesterday": 0.011, "Today": 0.111, "Period": 0, "Power": 6, "Voltage": 13.03, "Current": 0.470}, "DS18B20-1": {"Id": "3C01D6075272", "Temperature": 23.0}, "DS18B20-2": {"Id": "3C01D607E5E3", "Temperature": 23.3}, "TempUnit": "C"}
Rule1 takes care of the forwarding of the temperature values
Rule1
ON DS18B20#Temperature DO Var1 %value% ENDON
ON DS18B20#Temperature DO Add1 273.15 ENDON
ON DS18B20-1#Temperature DO Var2 %value% ENDON
ON DS18B20-1#Temperature DO Add2 273.15 ENDON
ON DS18B20-2#Temperature DO Var3 %value% ENDON
ON DS18B20-2#Temperature DO Add3 273.15 ENDON
ON DS18B20-3#Temperature DO Var4 %value% ENDON
ON DS18B20-3#Temperature DO Add4 273.15 ENDON
ON tele-DS18B20 DO publish vessels / self / environment / inside / DS18B20_1 / temperature %Var1% ENDON
ON tele-DS18B20-1 DO publish vessels / self / environment / inside / DS18B20_1 / temperature %Var2% ENDON
ON tele-DS18B20-2 DO publish vessels / self / environment / inside / DS18B20_2 / temperature %Var3% ENDON
ON tele-DS18B20-3 DO publish vessels / self / environment / inside / DS18B20_3 / temperature %Var4% ENDON
The temperature values are read in and converted into Kelvin, since SignalK always expects measured values in SI units.
Rule2ON ENERGY#Power DO Var5 %value% ENDONON ENERGY#Voltage DO Var6 %value% ENDONON ENERGY#Current DO Var7 %value% ENDONON ENERGY#Total DO Var8 %value% ENDONON ENERGY#Yesterday DO Var9 %value% ENDONON ENERGY#Today DO Var10 %value% ENDONON tele-ENERGY DO publish vessels / self / electrical / batteries / service / power %Var5% ENDONON tele-ENERGY DO publish vessels / self / electrical / batteries / service / voltage %Var6% ENDONON tele-ENERGY DO publish vessels / self / electrical / batteries / service / current %Var7% ENDONON tele-ENERGY DO publish vessels / self / electrical / batteries / service / energytotal %Var8% ENDONON tele-ENERGY DO publish vessels / self / electrical / batteries / service / energyyesterday %Var9% ENDONON tele-ENERGY DO publish vessels / self / electrical / batteries / service / energytoday %Var10% ENDON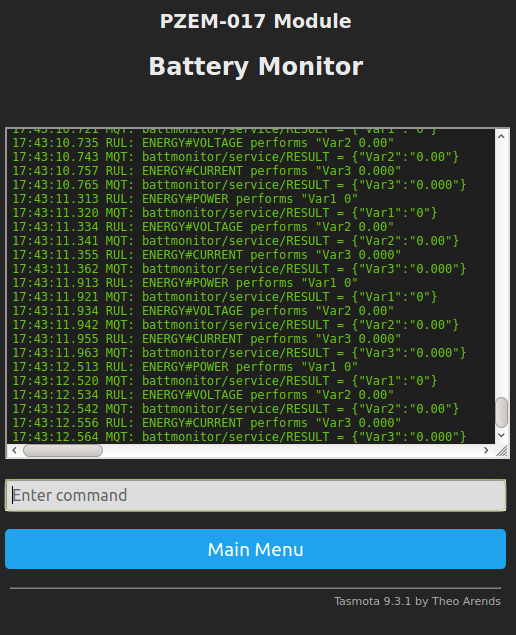
- RuleX 0 - deactivates a rule
- RuleX " - deletes a rule
- RuleX ON - activates a rule
Configuration in SignalK
On the Raspberry Pi you should first check whether an MQTT server like mosquitto running. The easiest way to do this is in a console with the command Top do. It shows a list of all running processes on the Raspi. If the MQTT server is running without being used, then you should use the command sudo apt-get remove mosquitto deinstall. If it is required, a port other than 1883 must be used in the configuration.
In SignalK the plugin signal-mqtt-gw under Appstore -> Available Installed. Under Server -> Plugin Config the following settings are then made.
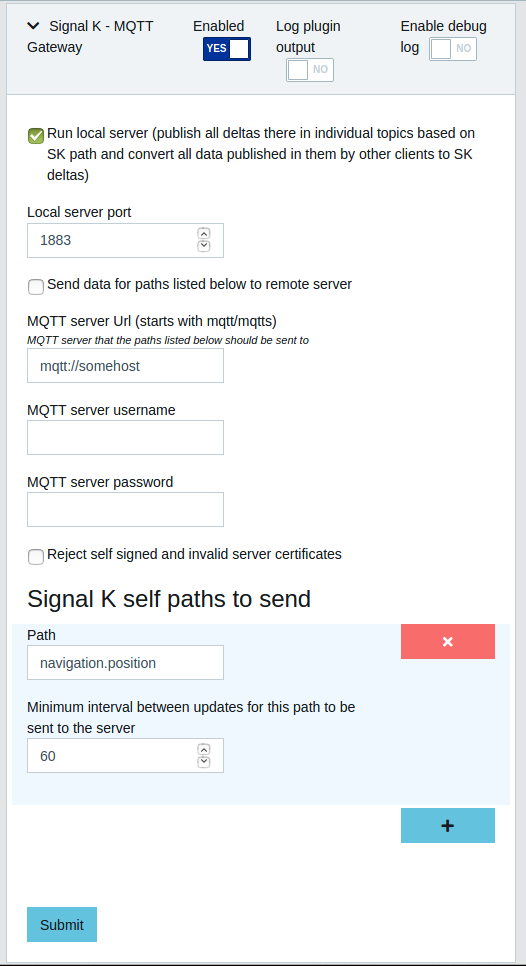
Fig: Plugin Config in SignalK
If everything is configured correctly, SignalK must be restarted. Then the data is in the Data browser to see.
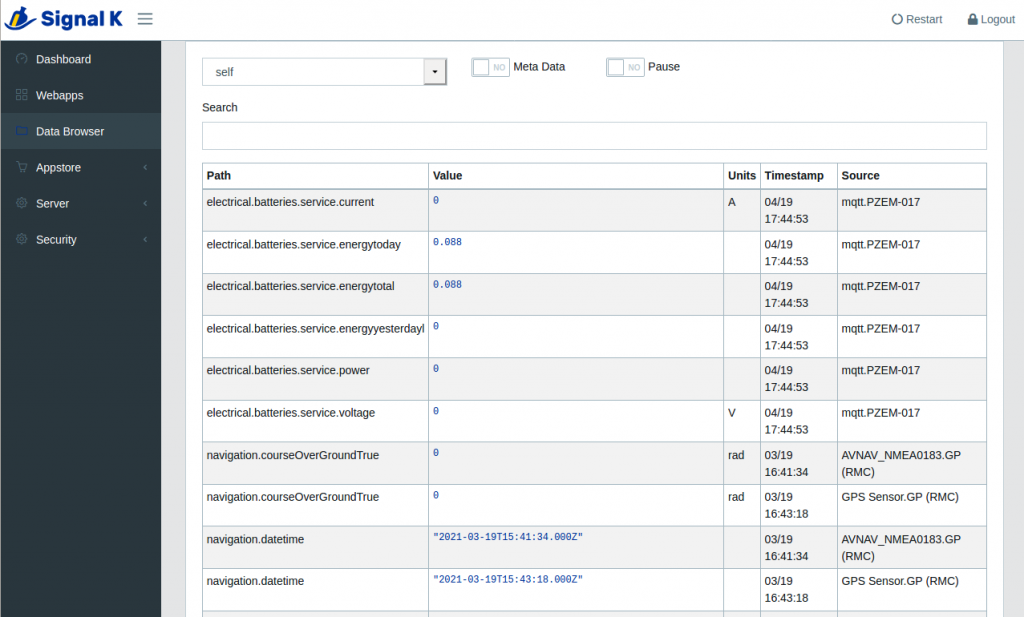
Fig: SignalK Data Browser
Depending on the number of connected 1Wire temperature sensors (DS18B20), temperature values are then displayed. If the InfluxDB database and the Grafana database front end are also installed, extensive graphic data evaluations can be carried out.
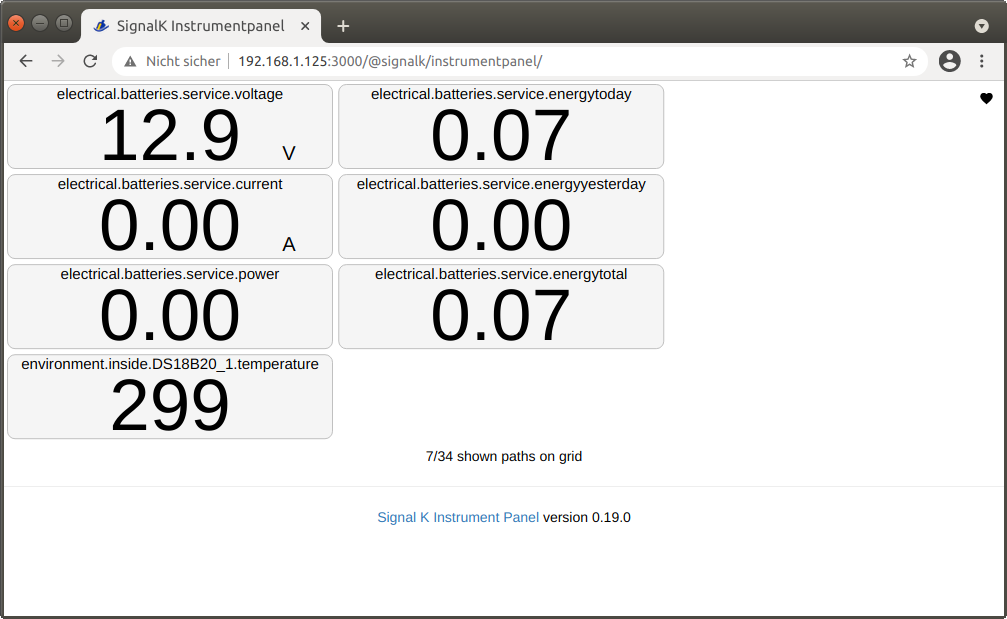
Fig: Measurement data in the SignalK instrument panel
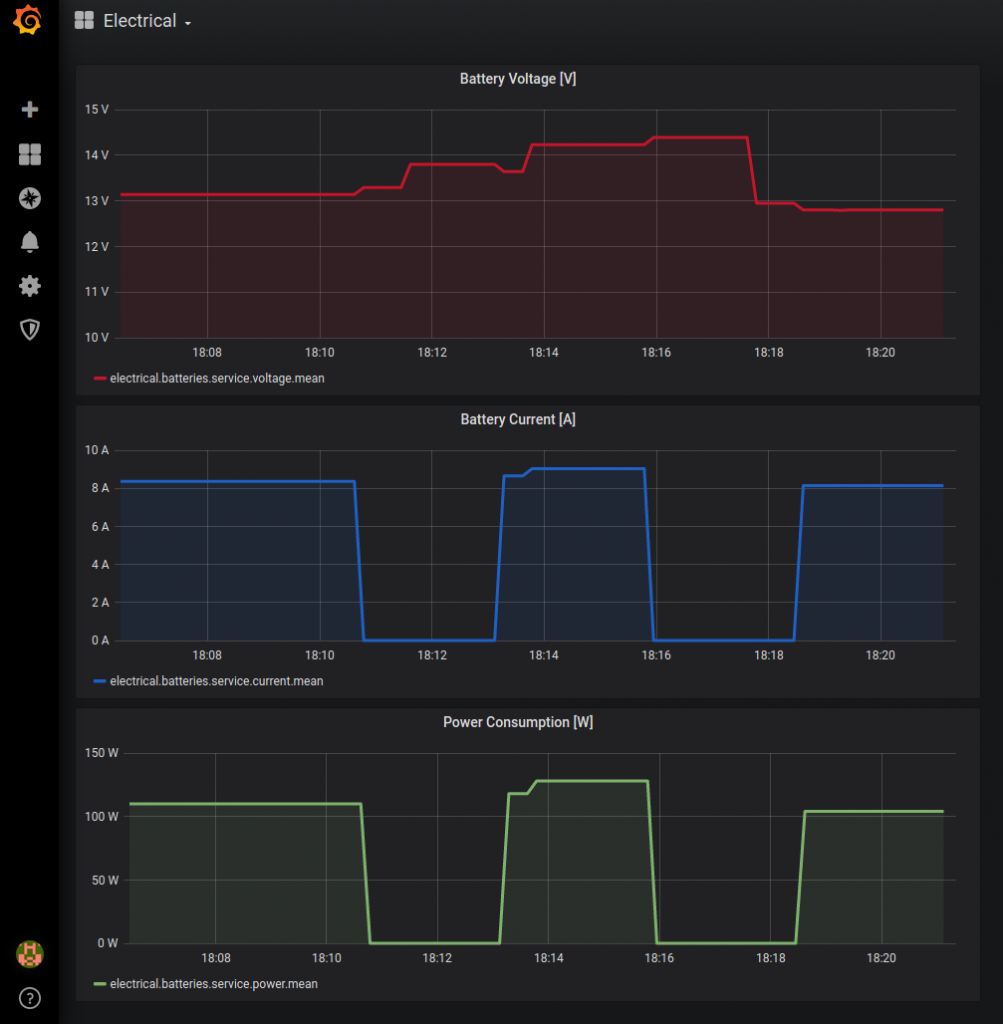
Fig: Measurement data visualized with Grafana