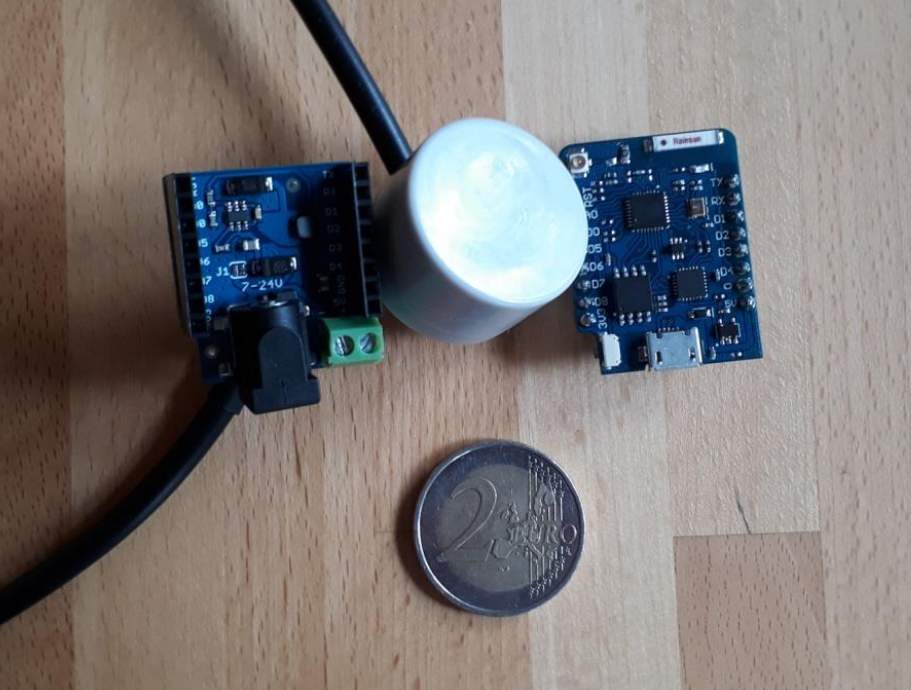
Fig.: Ultrasonic level measurement
The idea of the level sensor arose from several sailors in the sailing forum. Andreas built a prototype and tested it on various objects. A simple replica is possible by using ready-to-buy modules. The ultrasonic sensor records liquid levels in a tank and sends NMEA0183 telegrams to the on-board network via WLAN. These can then be visualized in AVnav or OpenCPN, for example. Due to the properties of the sensor, no hole has to be drilled in the tank, so this sensor is ideal as a retrofit solution for existing tanks without a level indicator. Thanks to the WLAN connection, no further data cables need to be laid. A 12V supply near the tank to which the microcontroller can be connected is sufficient. The Wemos D1 mini module is a microcontroller based on the ESP 8266 with a built-in WLAN module. The ultrasonic sensor is connected to the microcontroller via a serial interface. The ultrasonic sensor is glued to the outside of the tank bottom. The liquid level in the tank can then be recorded with this.
Caution: The sensor must be attached to the bottom of the tank and have contact with the liquid. This causes the sound to be transmitted into the liquid. So it has to “ping” from bottom to top in order to record the liquid level. Top-to-bottom ping over the air does not work. It has been found that pressing the ultrasonic sensor against the tank is not enough to transmit the sound into the liquid. You need contact gel or stick the sensor to the bottom of the tank. For test purposes, hand cream or grease can be used as a substitute for contact gel.
Characteristics of ultrasonic level measurement
- Supply voltage 7…24V DC
- Power consumption approx. 40 mA at 12V
- Measuring range 50…2000 mm liquid column
- Measurement every 2 s
- Data transmission WiFi 2.4GHz, 802.11bgn
- UDP, port 8888, broadcast
- Data format: NMEA0183, XDR
- Configuration: Website on first start
Ultrasonic sensor DS1603L
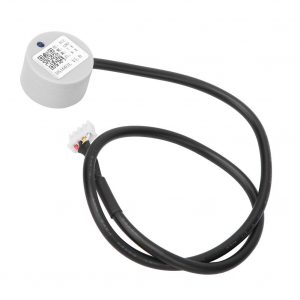
Fig.: DS1603L ultrasonic level sensor with serial data output
The ultrasonic sensor DS1603 is available in different versions. We use the version with a serial RS232 output, marked with an L at the end. But there are also other sensors (DS1603DA-3R) with an RS485 interface and Modbus as the transmission protocol. The DS1603L sensor, which is also compatible with the DA1603DA-3U, has loud data sheet the following properties:
characteristics
- Operating voltage: 3.3-12V DC
- Power Consumption: <35mA
- Blind Area: <= 50mm
- Measuring range: 50…2000 mm
- Output: UART RS232 serial 9600 8N1 (TX only)
- Resolution: 1mm
- Response time with liquid: 2s
- Response time without liquid: 10s
- Measurement accuracy: ± (3 + H x 0.5 %) mm
- not waterproof
- ESD Resistance: ±4/±8KV
data output
- 9600 Bd, 8 data bits, one stop bit, no parity bit (8N1).
- 4 bytes of data:
- Byte1 header: fixed value 0xFF
- Byte2 Data_H: high byte of height.
- Byte2 Data_L: low byte of height.
- Byte4 checksum
checksum: Checksum = (Header + Data_H + Data_L) & 0x00FF
Calculation of the filling level: Height [mm] = Data_H * 256 + Data_L
Meaning of the blue status LED
| LED state | meaning |
| permanently on | No sound level found |
| blinking | Ready to measure, sound level found |
At the beginning, the ultrasonic sensor tries to set the transmission level of the sound signal so that a measurement is possible. The sensor needs 10 s for this. During this time, the LED is permanently on. As soon as a valid echo signal has been detected, the blue LED starts flashing at a rhythm of 2 s. Each blink sends 4 bytes of data over the TX line. The RX line remains unused because no commands can be sent to the sensor. The sensor starts sending automatically without a special start command. If a measurement is not possible, the LED stays on permanently and the checksum is incorrect. However, 4 bytes of data are still sent out. Often the cause is a missing contact gel for sound transmission or insufficient sound transmission.
cable assignment
| Cable color | meaning |
| Red | 3.3-12VDC |
| Black | GND |
| Yellow | TX * |
| White | RX * |
* Voltage level dependent on supply voltage (4V signals at 5V supply voltage)
curve
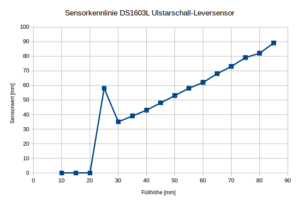
Fig. Sensor characteristic 0…90 mm at 5V supply voltage
Depending on the supply voltage, the ultrasonic sensor starts measuring at a liquid level of 30 mm. At 25 mm, however, an erroneous reading occasionally occurs, which is given as a liquid height of 60 mm. You should therefore not trust the measured values below 40...50 mm. Below 20 mm, no valid measurement signals are transmitted and the checksum is incorrect. The status LED is permanently on. The specification also shows a dead zone of 0…50 mm.
measurement accuracy and linearity
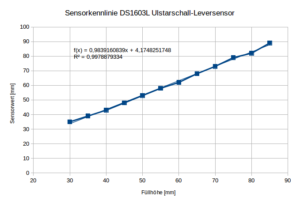
Fig. Linearity of the DS1603 in the valid measuring range 30…90 mm
The measurement accuracy is sufficiently accurate for a fill level measurement. The offset error on my model is about 4 mm. The slope is not exactly at 1.0. The measured values could be improved with an offset and slope correction.
Overall, however, when measuring the level in a tank, it must be remembered that there is a dead zone of 0...50 mm. The tank must have a certain height in order to be able to calculate the filling level with any degree of accuracy. The tank should have a minimum height of 250mm and be square. The liquid column above the sensor is measured with the ultrasonic measuring method. The tank level is specified as a percentage of the maximum level. If the tank geometry deviates from the cuboid shape, the output value does not correspond to the fill level in percent.
Data transfer
The Wemos is connected to the on-board network via the WLAN module. For this purpose, a setup page is called up when starting for the first time and whenever there is no known WLAN network. If the microcontroller is connected to the network and the sensor has detected a liquid level in the tank, the corresponding NMEA0183 data sets are sent to the on-board network via UDP as broadcast transmissions. Broadcast means that the data records are sent to all network participants at the same time and no special IP address is required for communication. The configuration page closes automatically if the sensor was able to log into the on-board WiFi or automatically after 10 minutes.
| parameter | value |
| SSID | Ultrasonic Sensor |
| password | 12345678 |
| transmission type | WiFi 2.4GHz, 802.11bgn |
| data type | NMEA0183 |
| telegram | XDR: $IIXDR,V,15,P,FUEL*56 (reading in percent of tank height) |
| transmission type | UPD, Broadcast |
| port | 8888 |
Fig. Transmission parameters
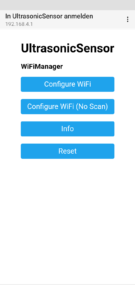
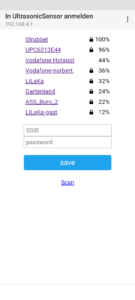
Fig. Configuration page
circuit design
The circuit structure is quite simple. Only a few components and cable connections are required.
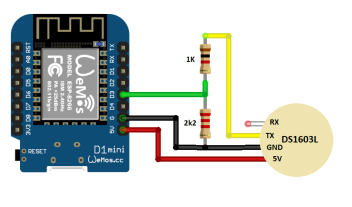
Fig. Ultrasonic sensor circuit
The following parts are required for the ultrasonic sensor:
| position | number | designation | source | comment |
| 1 | 1 | Wemos D1 mini | Makershop.de | |
| 2 | 1 | Wemos 7-24V 1A DC Power Shield | Makershop.de | |
| 3 | 1 | Resistor 1k, 1/4W | Pollin.de | |
| 4 | 1 | Resistor 2k2, 1/4W | Pollin.de | |
| 5 | 1 | stranded wire | Pollin.de | optional |
| 6 | 1 | shrink tubing | Pollin.de | optional |
| 7 | 1 | casing | Pollin.de |
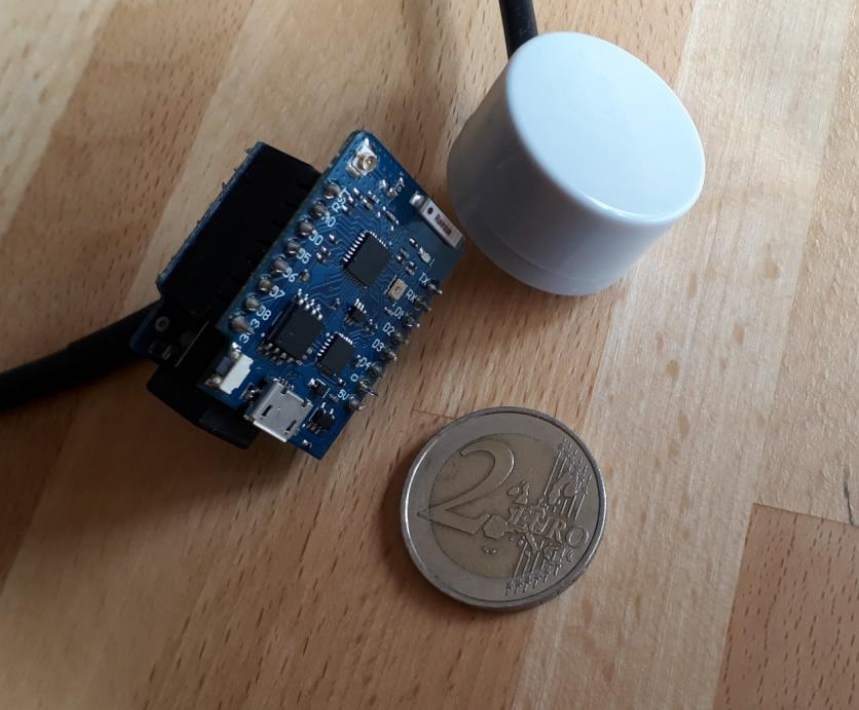
The ultrasonic sensor is soldered to the respective pins of the Wemos D1 mini and then plugged onto the power shield. Everything is then housed in a waterproof case.
Adaptation of the firmware
In the default setting, the firmware uses a tank with a height of 400 mm as the tank geometry. In line 109, im Source code of the main.cpp file the tank height can be adjusted.
109 int percent = (h / 400.00) * 100;
The entire source code of the firmware can be found at GitHub:
https://github.com/norbert-walter/NMEA0183-Level-Sensor-DS1603L
If you want to compile the source code yourself, you can do so with PlatformIO do. PlatformIO is an extension for the programming environment Visual Studio Code from Microsoft and supports a range of microcontrollers from the DIY sector. How one PlatformIO under Visual Studio Code installed is described here:
https://www.az-delivery.de/blogs/azdelivery-blog-fur-arduino-und-raspberry-pi/plattformio
or
https://iotgrizzly.de/ide-platformio/
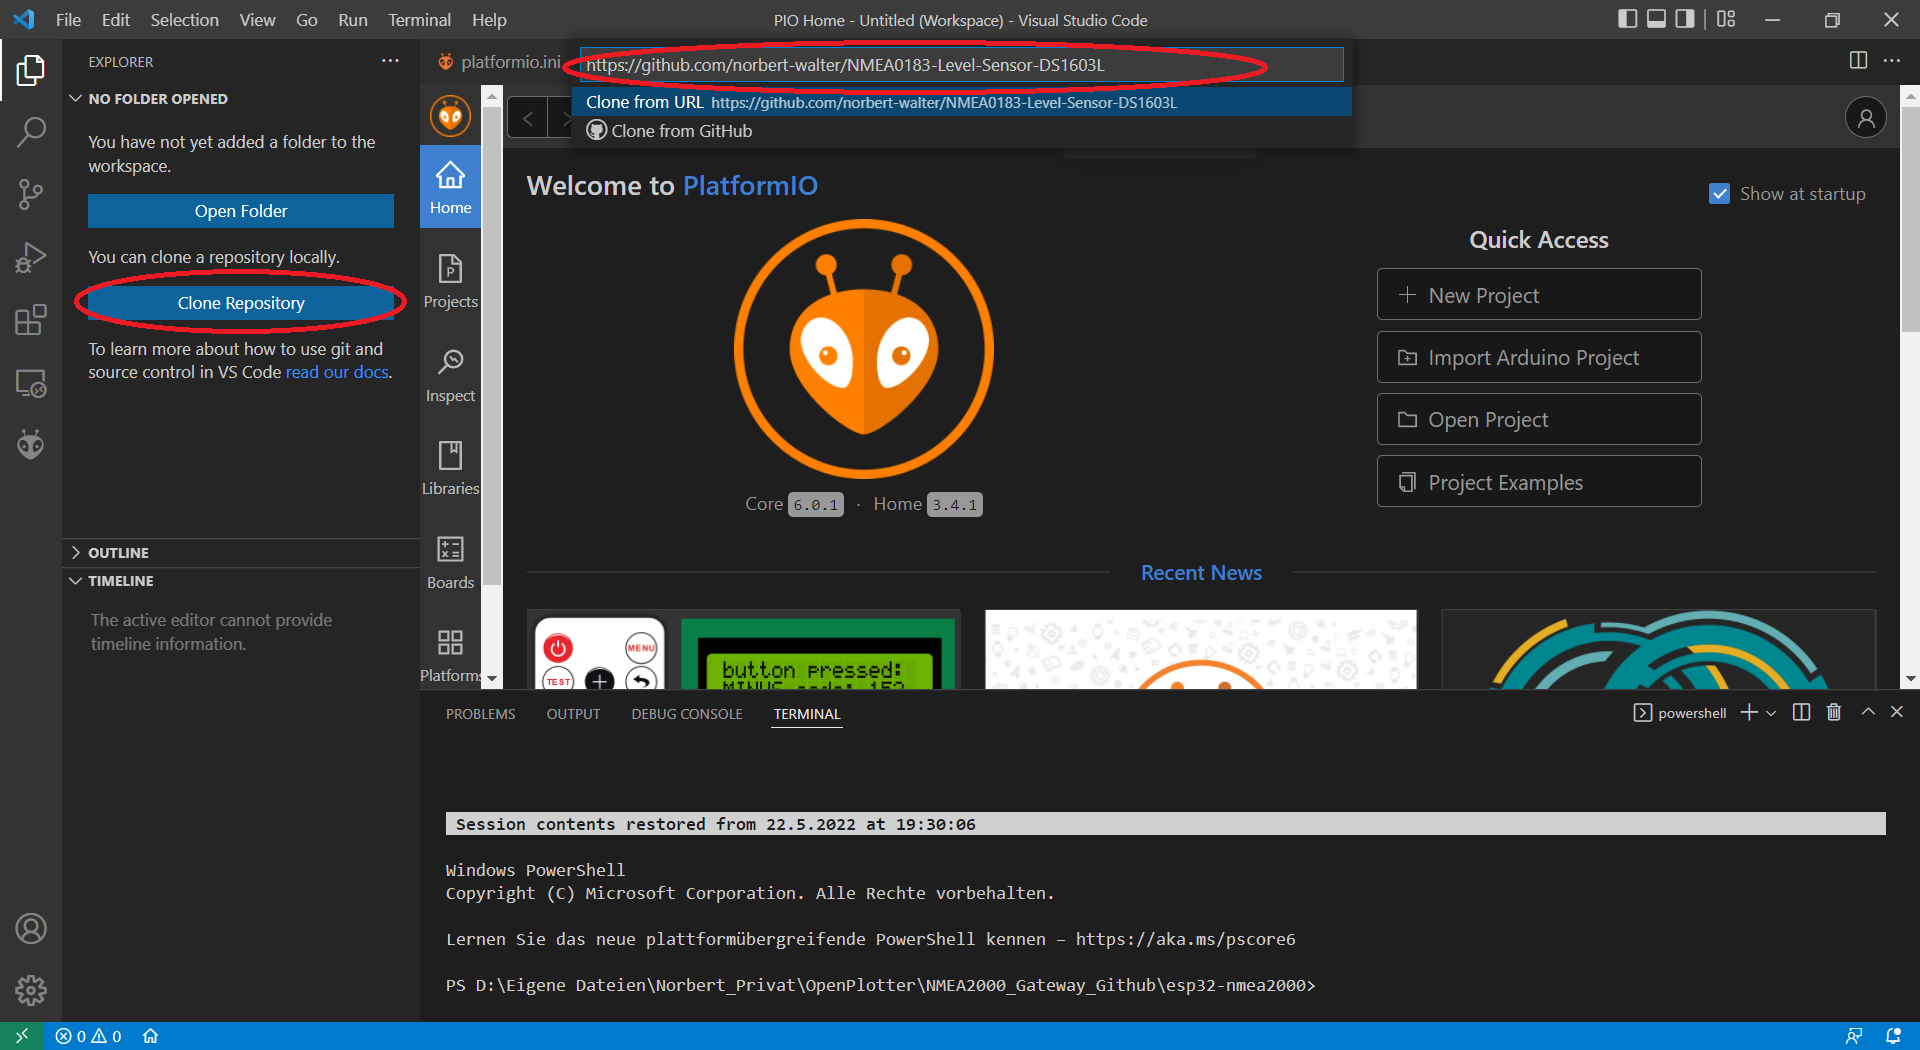
is PlatformIO set up, the GitHub repository can be copied quite easily. To do this, click on the button Clone Repository and enter the web address of the repository under which the project is stored on Github (https://github.com/norbert-walter/NMEA0183-Level-Sensor-DS1603L) in the address line.
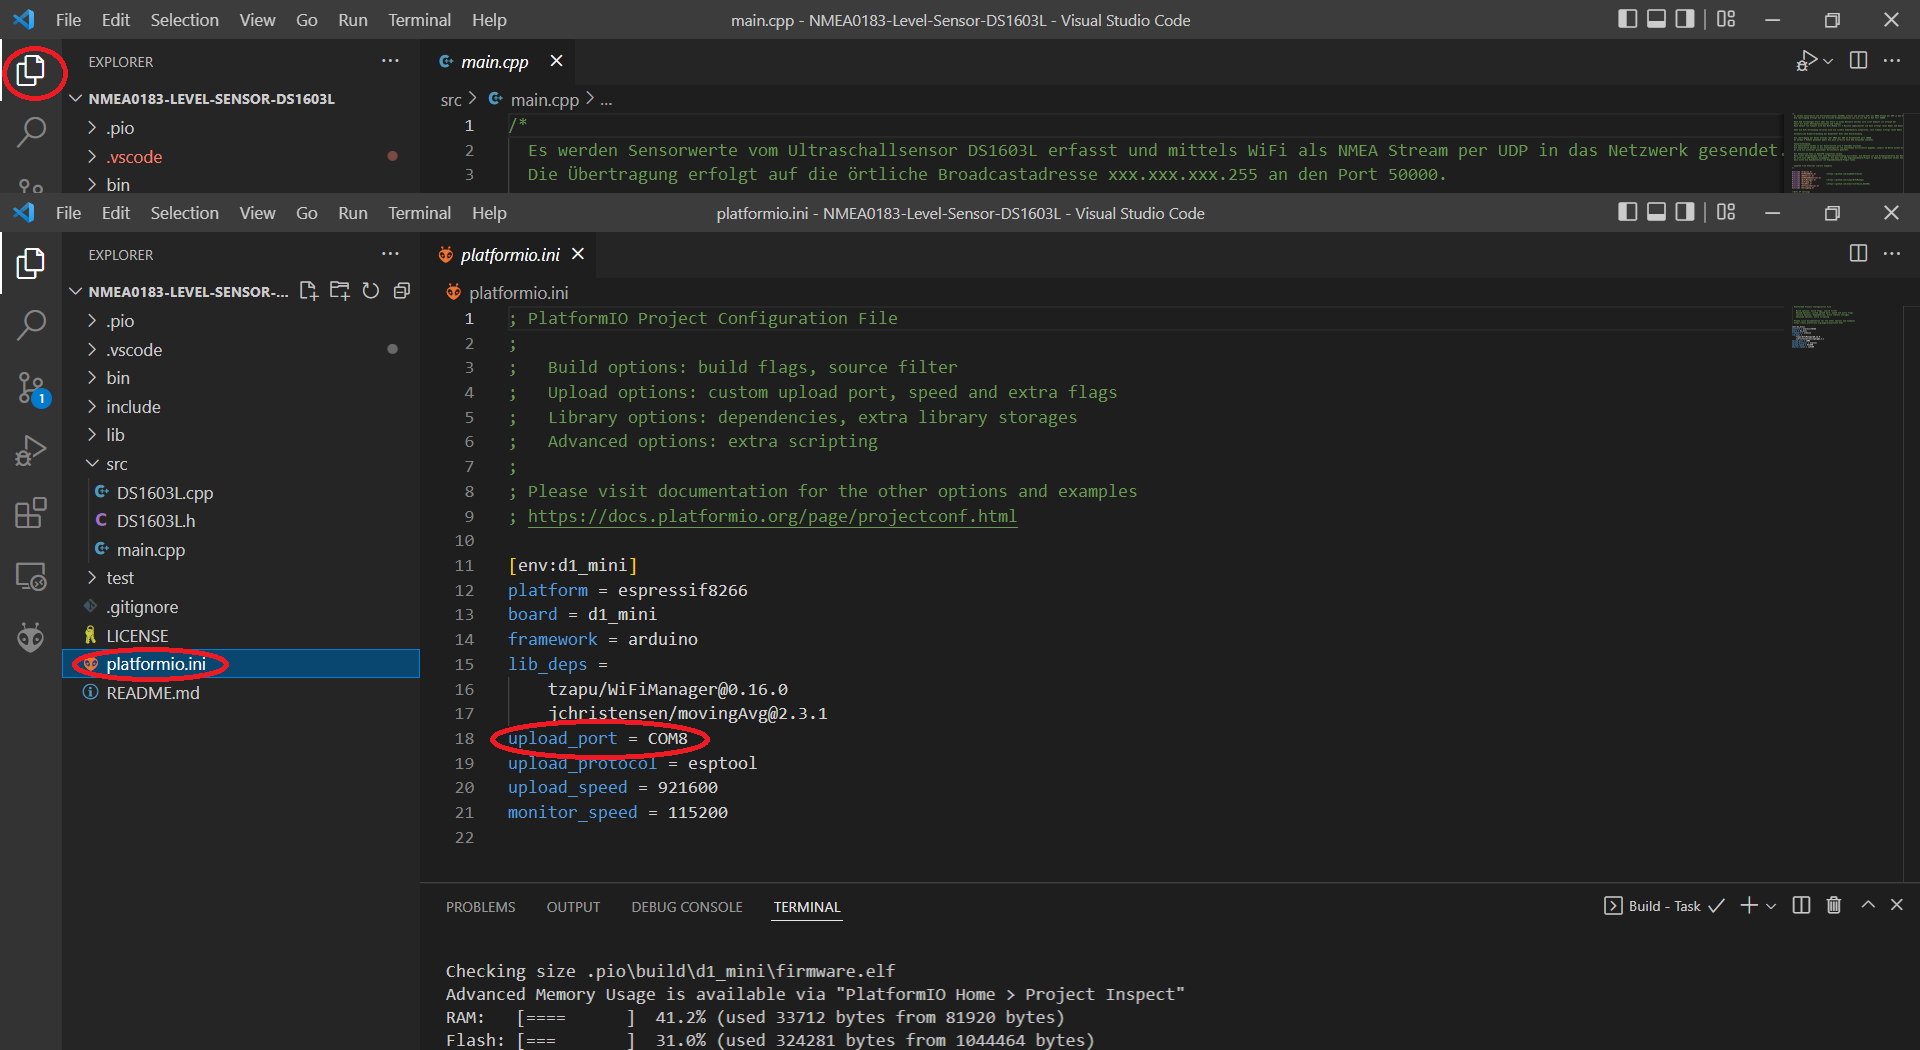
Then you select a directory in which the project is saved. You have to answer yes to the question that you trust the source and really want to download the software. The project can then be seen in the workspace. Then we close and reopen Visual Studio Code so that the workspace loads correctly with PlatformIO. Then we should set the correct COM interface via which our Wemos D1 mini is connected. We do that by opening the file platformio.ini customize and save. Otherwise the firmware cannot be flashed.
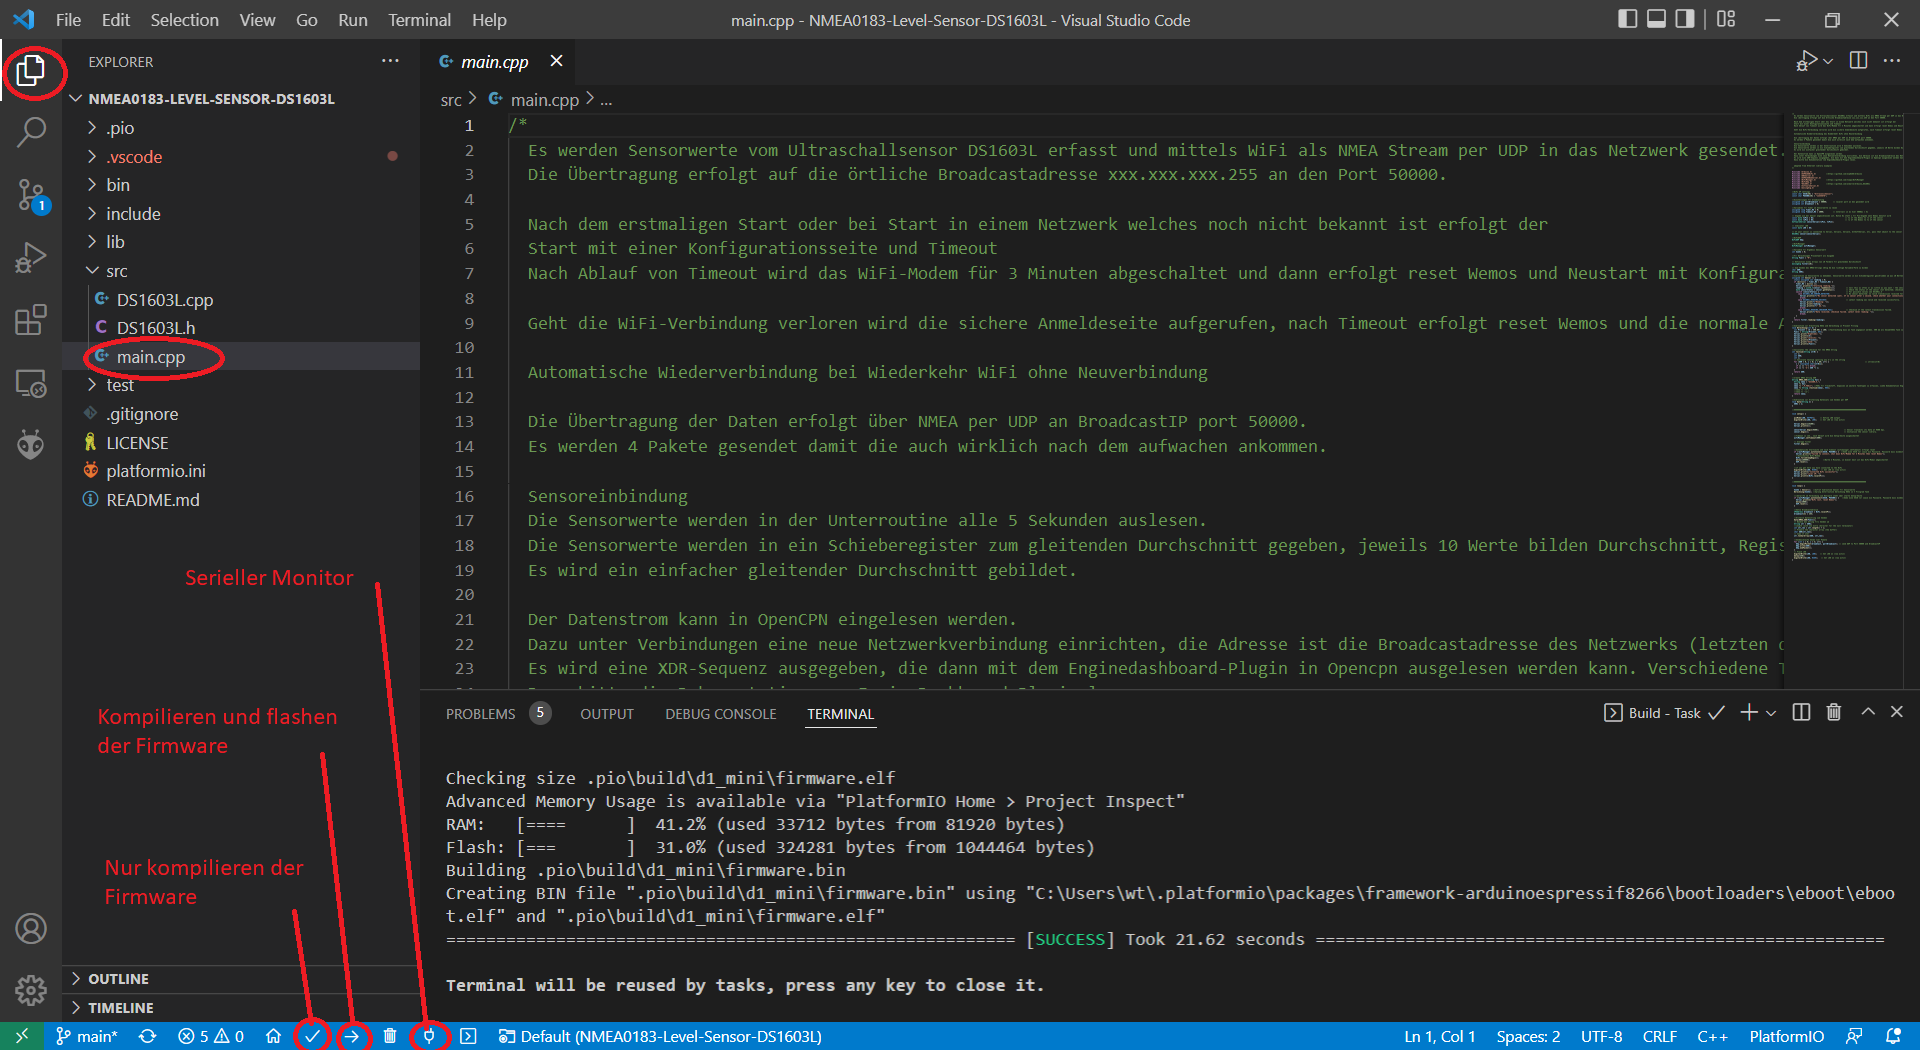
Now we have a finished development environment for our project and can compile and flash the firmware ourselves.
Anyone going to all the trouble of setting up Visual Studio Code and PlatformIO want to save, the finished compiled binary file can be used with the NodeMCU Flasher transferred to the Wemos D1 mini.
Flashing the firmware as binary
The firmware is flashed as a binary using a micro USB cable that is connected to the Wemos D1 mini and the PC.
Flash guide
- Connect USB programming cable to laptop or PC
- Programming software NodeMCU Flasher start on laptop or PC and Firmware load
- Start the programming process
- After successful programming, disconnect the USB programming cable
- Switch on 12V and set WiFi connection parameters via AccessPoint
NodeMCU Flasher
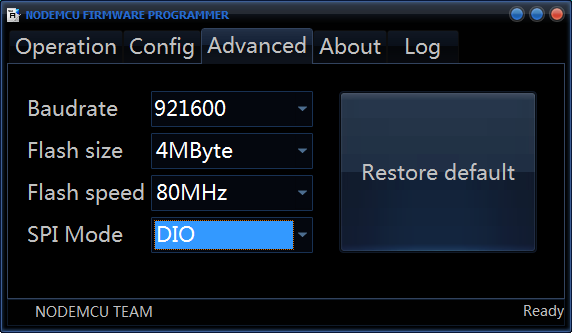
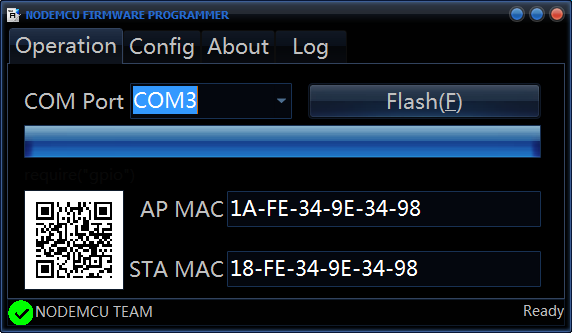
The easy-to-use Windows tool can be used as programming software for the Wemos D1 mini NodeMCU Flasher be used. The EXE file can be started directly without special installation. First are under Advanced made the following settings. If you use a Wemos D1 mni Pro, you have to Flash size set to 16MB.
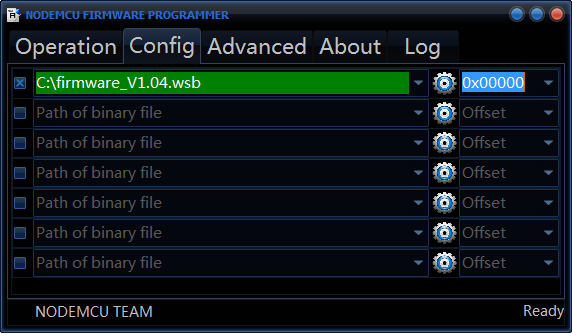
After that, under Config the current firmware file firmware.bin selected.
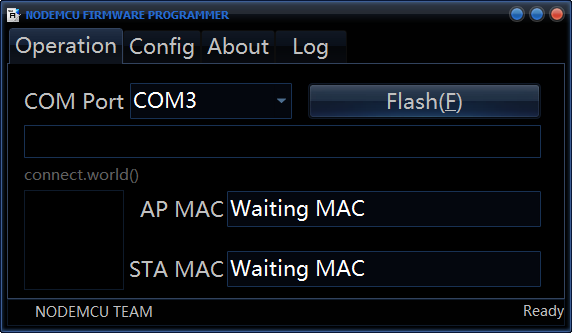
You open up to flash surgery and selects the corresponding COM interface to which the Wemos D1 mini is connected. Then you press Flash and waits for the firmware to load.
The progress of the transfer is displayed during the flashing.
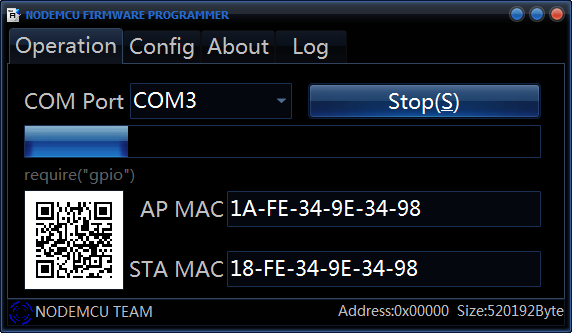
If the firmware has been successfully loaded, the following screen will appear.
After the transfer, the programming tool can be closed and the adapter removed.
Integration in SignaK
So that the level value SignalK we need the plugin xdr-parser-plugin. It translates the universal XDR telegrams, which are an extension of the NMEA0183 telegrams. The plugin can be installed via the app store integrated in SignalK. After the installation, the SignalK server needs to be restarted. After that we have to do this xdr-parser-plugin under Server -> Plugin Config configure. More details on how to do that xdr-parser-plugin must be configured can be found here: https://github.com/GaryWSmith/xdr-parser-plugin
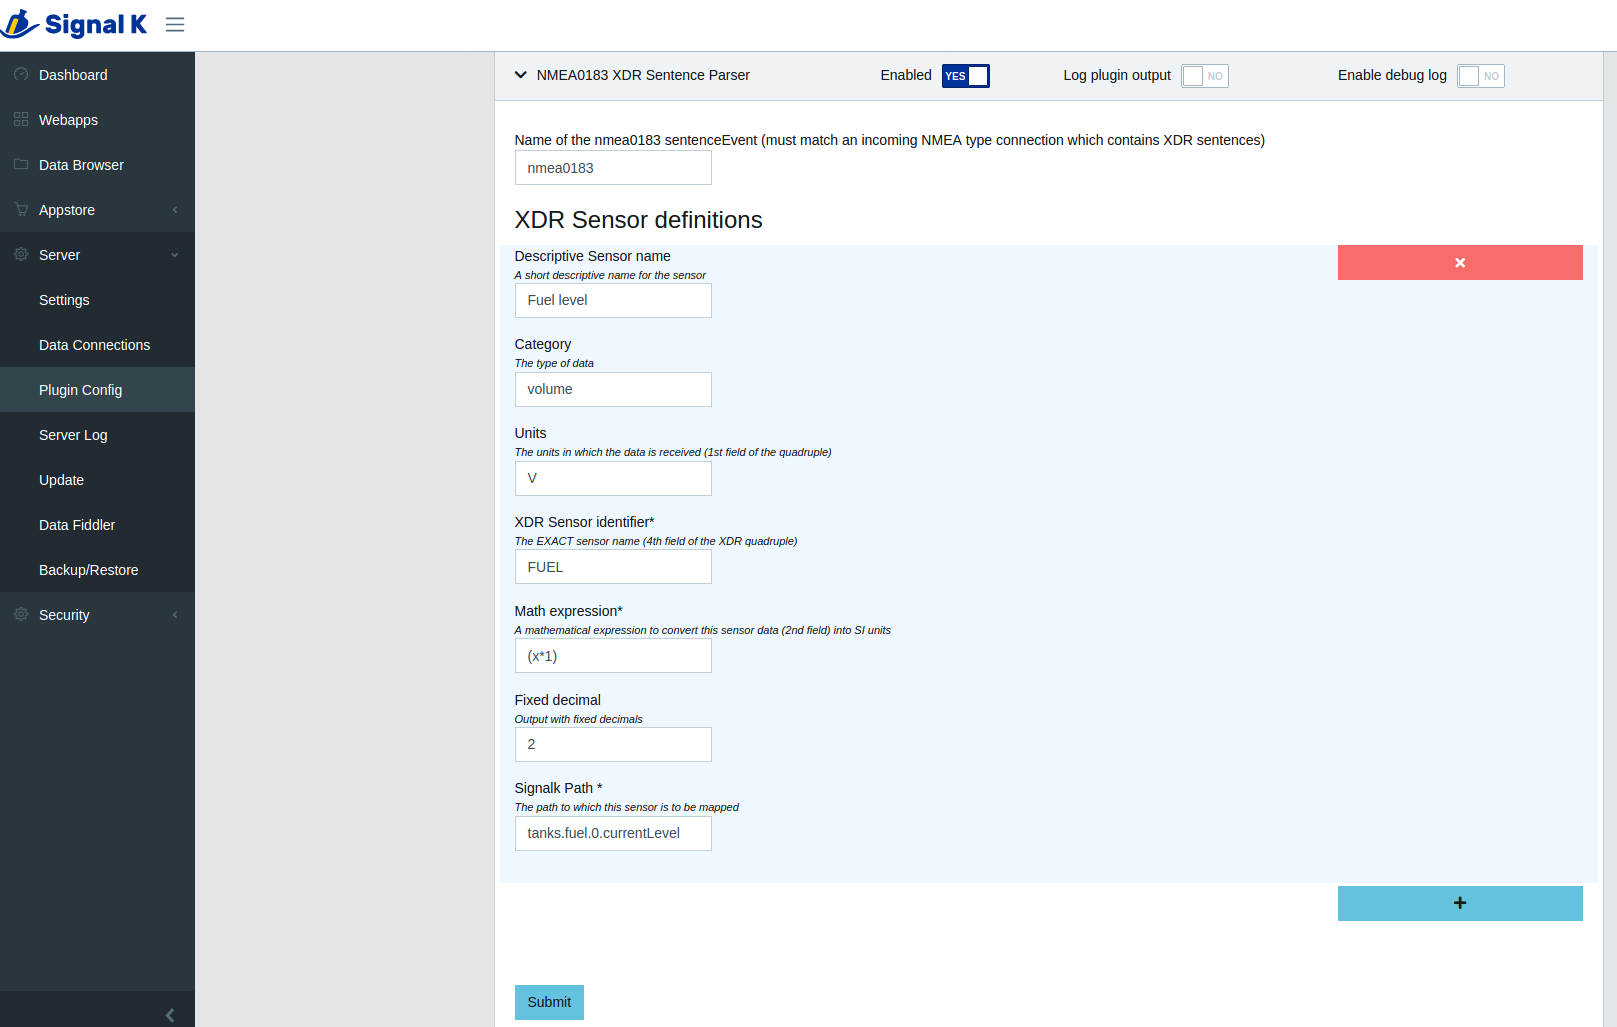
Fig. Plugin Config
After that we put a new data connection underneath Server -> Data Connection for the tank sensor and restart SignalK.

Fig. Data Connection
The data can then be seen in the dashboard and data browser.
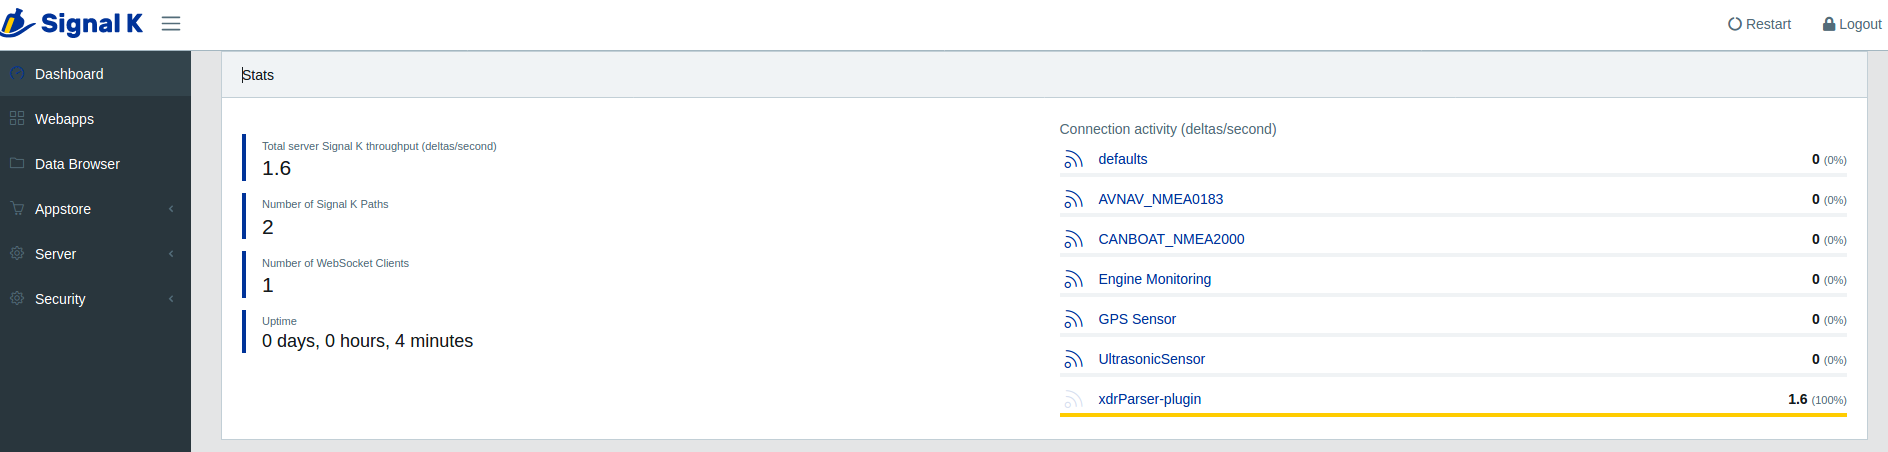
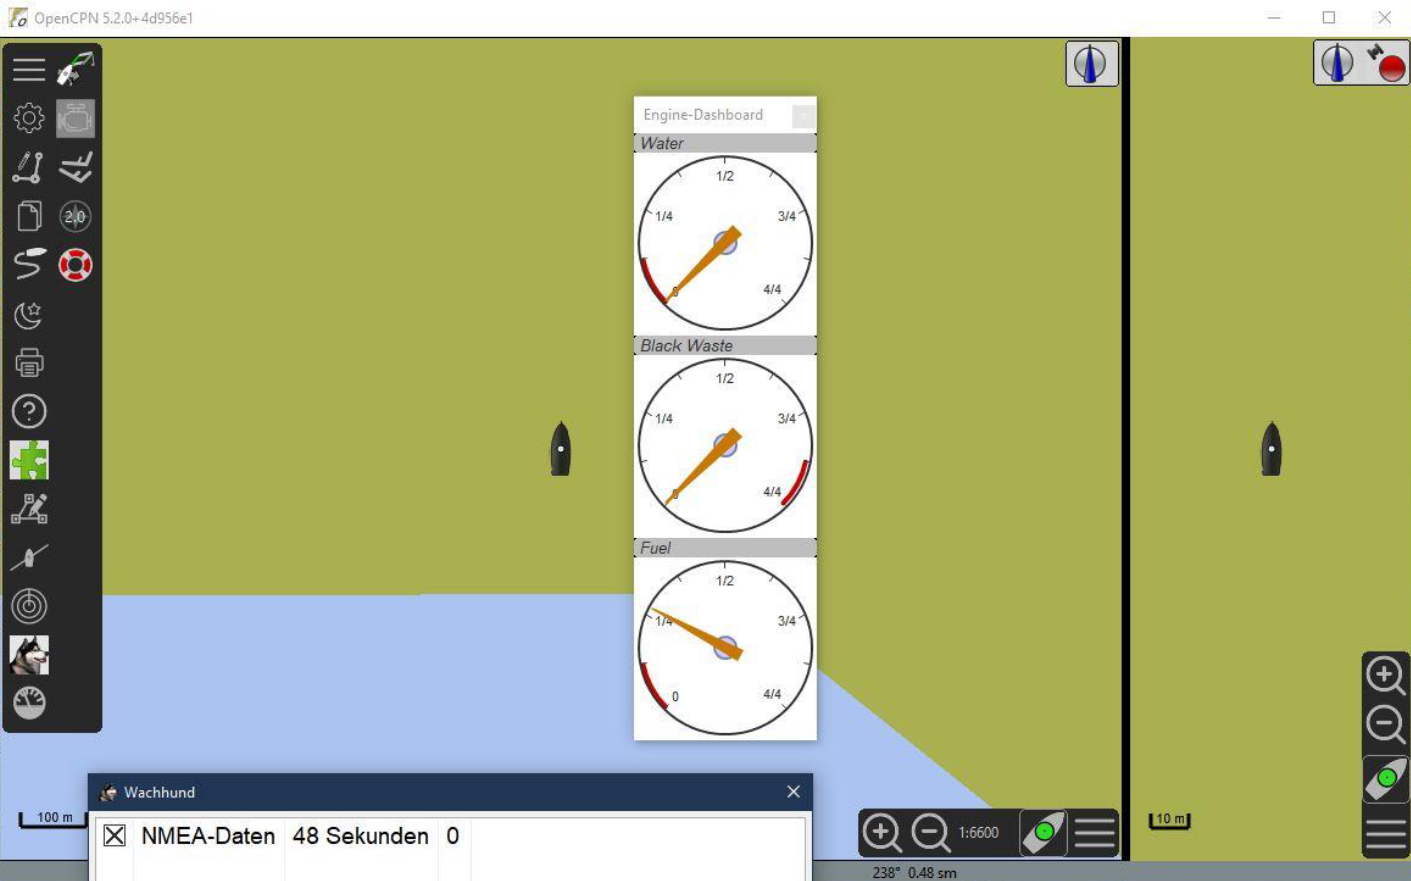
Fig. Dashboard
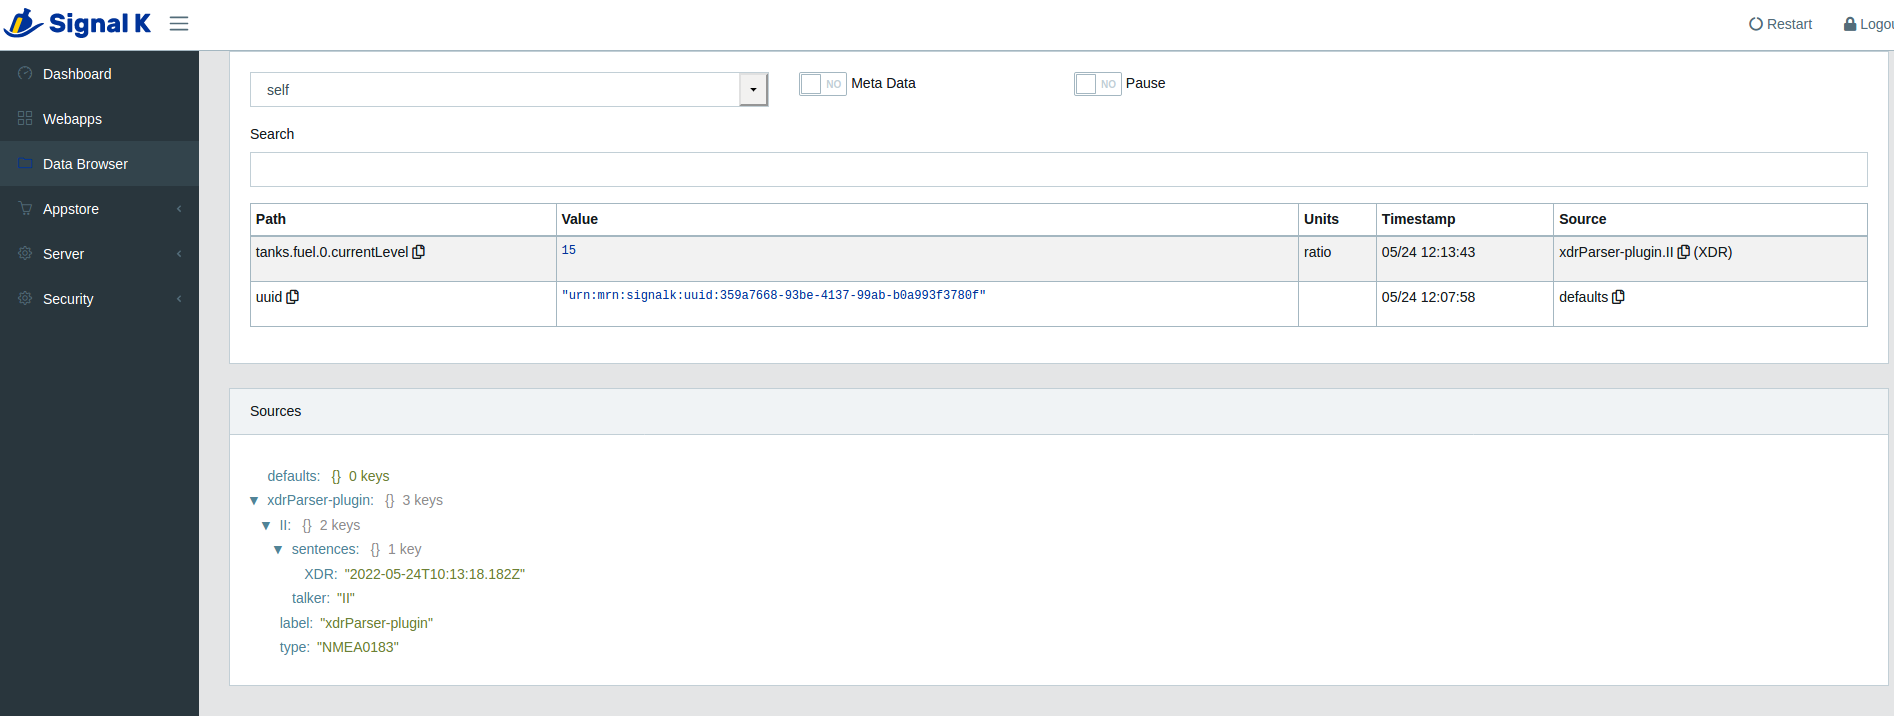
Fig. Data Browser
calibration function
With another SignalK plugin @signalk/calibration a calibration function can be added to the level sensor. A connection between the input and output values is established with the help of a calibration table. The plugin then automatically converts the incoming values so that they are displayed correctly. This makes it possible to display the correct filling level values without adapting and compiling the firmware. You then fill the tank by the liter without an activated calibration plugin and write down the values displayed in a table Data browser on. Then the values are transferred to the calibration plugin. After restarting the SignaK server, all measured values are converted. It is important to specify the correct source for the data source. You can find it in the last column of the data browsers. The same SignalK-Path must be specified under Path as in the first column of the data browsers sees. Other data paths are not permitted and result in the measured values not being converted.
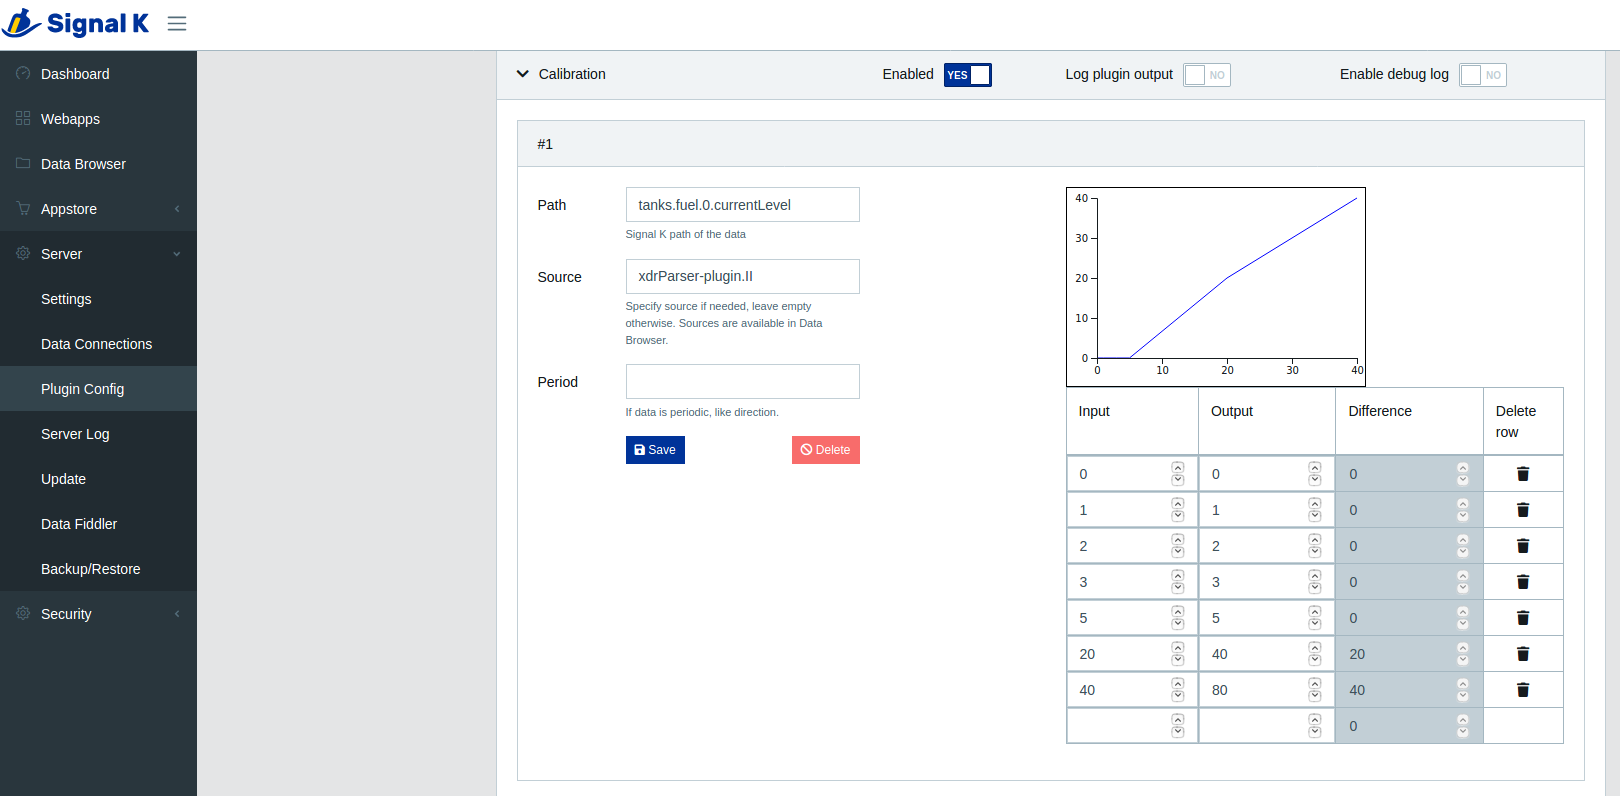
Fig. Calibration
If you want, you can then display the data in the instrument panel.
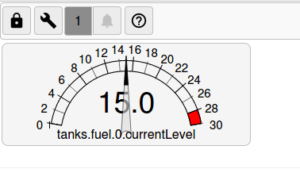
Fig. Instrument panel with level indicator
pictures