Registration with Ubidots
Ubidots is a commercial cloud service provider for visualization and data storage for IoT devices. For home users and educational institutions, there is an offshoot of Ubidots by the name Steam. This is a free and feature-limited version of Ubidots. The limitations are as follows:
- Devices: Up to 10 devices. First 3 devices free, then $ 4.5 / device / month
- Variables: Up to 10 variables per device
- Plugins: Up to 1 plugin with 10,000 plugin executions per month
- Data recording: 4,000 points per day across all your devices
- Data Extraction: 500,000 points per day across your entire account
- Data rate: 1 request per second across all your devices
- Data retention: 1 month
- Dashboard: Up to 3 dashboards with up to 10 widgets each
- SMS and voice calls: 10 free SMS and 1 voice call per month (US and Canada only)
- Alerting: 1 email address
The free Steam version is completely sufficient for boat monitoring, although you have to be careful not to transfer and query too much data. If any limits are violated, Ubidots will stop the service and restore the service the following day as long as none of the limits have been violated. Troubleshooting is then a bit time-consuming, because you don't see at first glance why something isn't working. Therefore, you should make sure to stay within the limits as much as possible.
The following resources are required for the boat monitor:
- Devices: 1
- Variables: 10
- Plugins: 1
- Data recording: 4,000 points per day
- Data Extraction: 500,000 points per day
- Data rate: 1 request every 5 minutes
- Data retention: 1 month
- Dashboard: 1 dashboard with up to 10 widgets each.
- Alerting: 1 email address
Calculation of the data volume
The LoRa boat monitor uses 12 readings that are passed to Ubidots. That's 2 variables more than allowed. However, we will only import 10 readings into Ubidots out of the 12 readings. As you may have noticed, the GPS data is transmitted twice in different formats. The reason for this is that different formatting is used to locate the LoRa boat monitor within TTN V3 and Ubidots and they are therefore transmitted twice. This ensures that the boat can also be displayed on the map in Ubidots.
{
"alert1": 1,
"dewpoint": 10.4,
"humidity": 29.35,
"latitude": 51.193901,
"length": 6.796773,
"location": {
"context": {
"lat": 51.193901,
"long": 6.796773
},
"value": 0
},
"pressure": 1020.8,
"tempbattery": 17.2,
"voltage": 11.28
}
With 4000 data points per day, this results in a maximum possible transmission rate of 5 minutes ((60*24)/(4000/12)=4.32). If the number of measured values to be transmitted is reduced, the transmission rate can be increased. However, a transmission rate of 5 minutes should be perfectly sufficient.
We have to be a little careful when querying historical data, as we can quickly breach the 500,000 data points per day. If we create a line diagram with, for example, 5 different measured values, a simple monthly query of the data can quickly add up to 43,200 data points (12*5*24*30=43,200). If the diagram is queried 12 times in a row, the 500,000 data points for the queries are used up and no further queries can be made. The chart then shows no data. Therefore, one should be as economical as possible with the data query over long periods of time.
The flow of configuration for data integration in Ubidots looks like this:
- Login to Ubidots
- Create a plugin for webhook at Ubidots
- Set up webhook at TTN V3
- Checking the webhook functionality
The exact configuration of these 4 points can here in detail be viewed.
Display of measured values and alarms in the Ubidot Dashboard
With the Ubidot Dashboard, the data from the LoRa boat monitor can be displayed. To create new displays and diagrams, the green plus button on the right can be pressed. This allows a large number of display elements to be used. A data source is requested during parameterization. The device is displayed as the source and listed values of the data source can be used for the display element.
If you want to learn more about using the dashboard, you can Help from Ubidot to use.
Caution: In general, it should be noted that only 10 display elements can be used in the free version. Otherwise, if this rule is violated, no more data will be displayed.
A custom dashboard page could look like the image below.
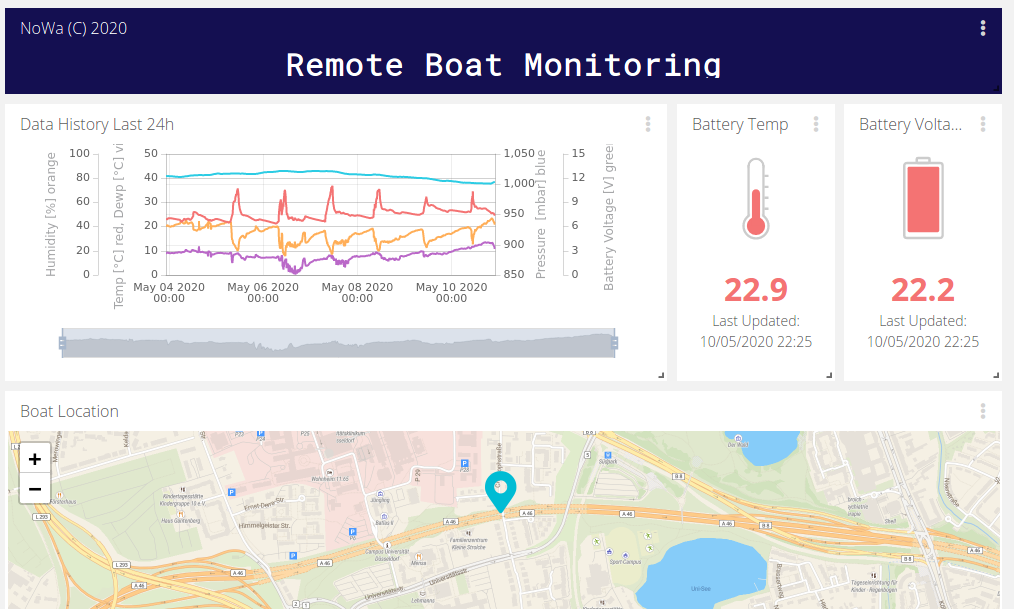
Fig.: Dashboard with data from the LoRa boat monitor
Tip: Created dashboards can also be made available to other users via a link. The dashboards can only be viewed and not changed. They can also be integrated into your own websites. See details here.
A trigger signal, which sends a mail message, can be set for all measured values to alert when limit values are exceeded. The alarm is configured under Data -> Events. How the configuration is made exactly, the Event creation help be removed.
Caution: Only email notifications can be sent in the free version. If you need other alerting options, you have to switch to the pay version of Ubidots.