To display sensor data of the LoRa boat monitors Several services are required in Grafana running in a Docker environment. LoRa boat monitor data located at TTN V3 is webhook to Telegraf service. Telegraf decrypts the received JSON information and stores the sensor data in an Influx-DB database. Grafana has access to this database and can display the sensor data via predefined pages.
The flow of configuration for data integration in Grafana looks like this:
- Set up webhook for Telegraf at TTN V3
- Checking the webhook functionality
- Representation of the sensor data in Grafana
Table of contents
Set up webhook at TTN V3
At this point the webhook for Telegraf at TTN V3 is set up. The webhook forwards the incoming data from the boat monitor at TTN V3 directly to the telegraph service every time.
Next, we switch to TTN V3 and log into the console there:
https://eu1.cloud.thethings.network/console/
Then we pass Applications to our created application LoRa Boat Monitoring and click in the left selection area integrations on.
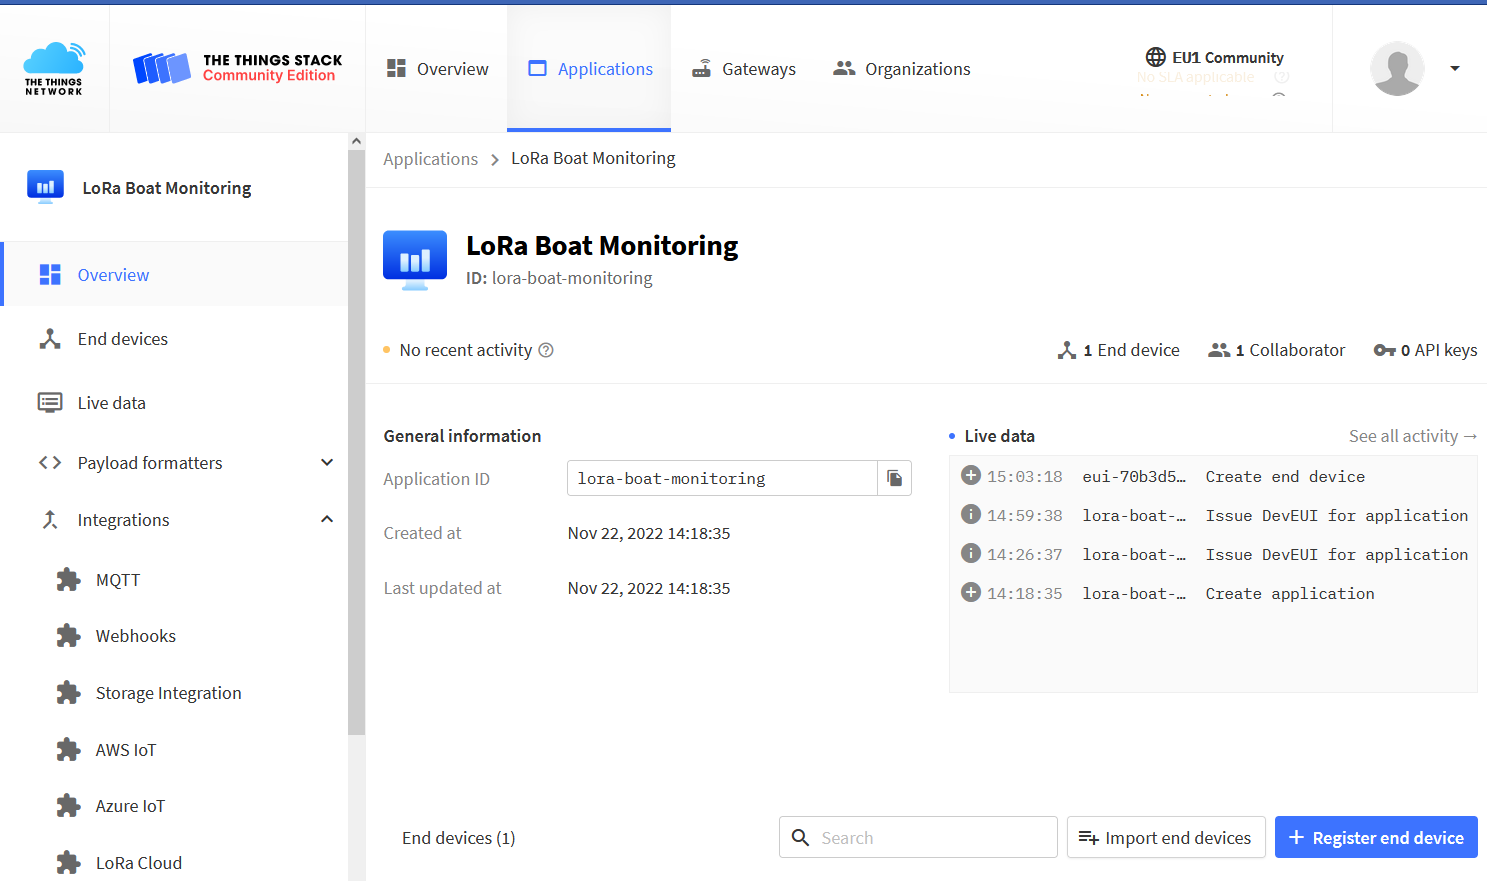
Fig.: Integrations
If we click left in the selection area webhook Clicking takes us to a page where we can create a new webhook with the right blue button Add Webhook can create.
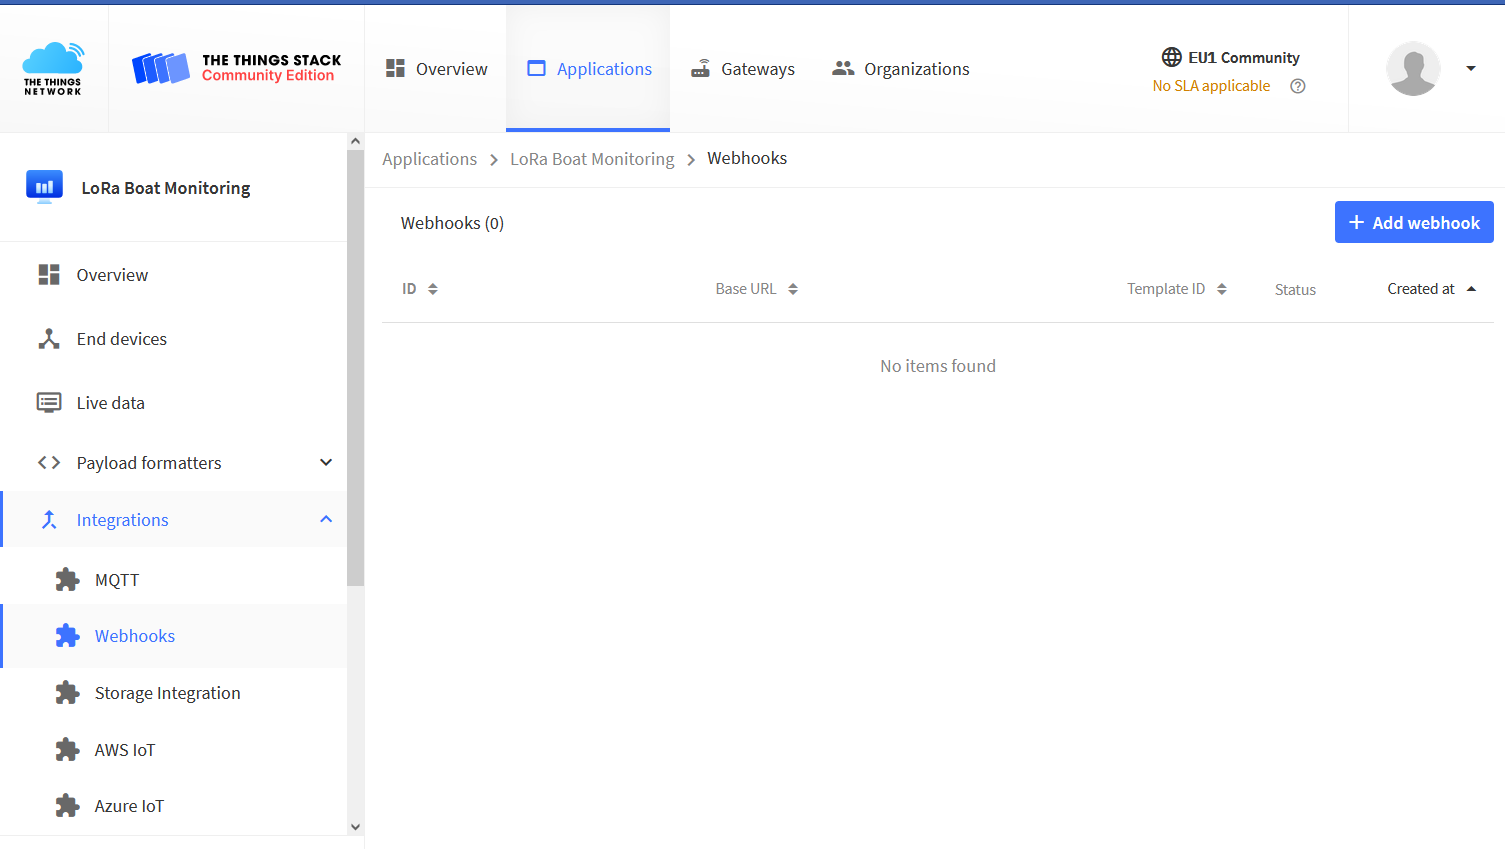
Fig.: Create webhook
On the page that opens, we choose at the top Custom webhook and then enter the following data in the configuration page:

Fig.: Configure webhook
For the Webhook ID we assign a meaningful name, such as telegraph. Pay attention to lower case and only use hyphens. As BaseURL use: http://norbert-walter.dnshome.de:8080 The webhook format must up JSON stand. Under Enabled event types got to Uplink message be activated and /telegraph be entered. All other fields remain empty.
Finally, the data entered is saved using the button Add webhook saved. In the end everything should look like this. the webhook is now set up.

Fig.: Completed webhook
Checking the webhook functionality
As soon as data from the LoRa boat monitor arrives at TTN V3, this data should appear on the page End Devices be visible under the respective device. Under live data the incoming telegrams are listed.

Fig.: Device Live Data (currently without data)
When data arrives from the LoRa boot monitor, then the status of the webhook for Telegraf should be from pending on Healthy switch and be marked with a blue dot.
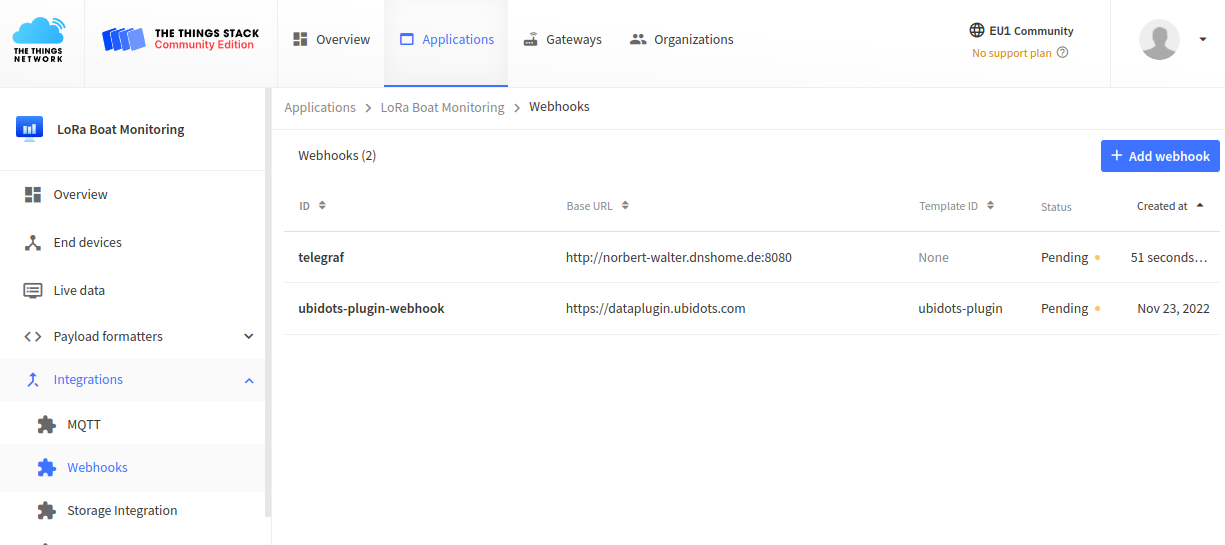
Fig: Webhook Status
This completes the configuration of the webhook.
Representation of the sensor data in Grafana
Grafana is a web-based universal tool for displaying data from various data sources. Open Boat Projects provides server services with which Grafana can be used free of charge and without data limits. Anyone who has their data forwarded to the Open Boat Projects servers via the webhook can use this service. The data retention period is one year. Older data is automatically deleted. Only you can access your data via the unique device EUI. Grafana allows you to create dashboards with different display elements. Grafana is a powerful tool and offers a huge library of predefined display elements. A separate component library was created for the LoRa boat monitor, creating a finished dashboard that users can use.
Log in
The Grafana page is accessed at: https://norbert-walter.dnshome.de/
Guest access has been set up for users, which does not require any special prior registration. As soon as the webhook is functional and sends data to Telegram, the sensor data is written to the InfluxDB database and can be displayed by Grafana. No further configuration in Grafana is necessary. Sign in with the following data:
Username: guest
Password: loragast
You will then go directly to the dashboard with the data display.
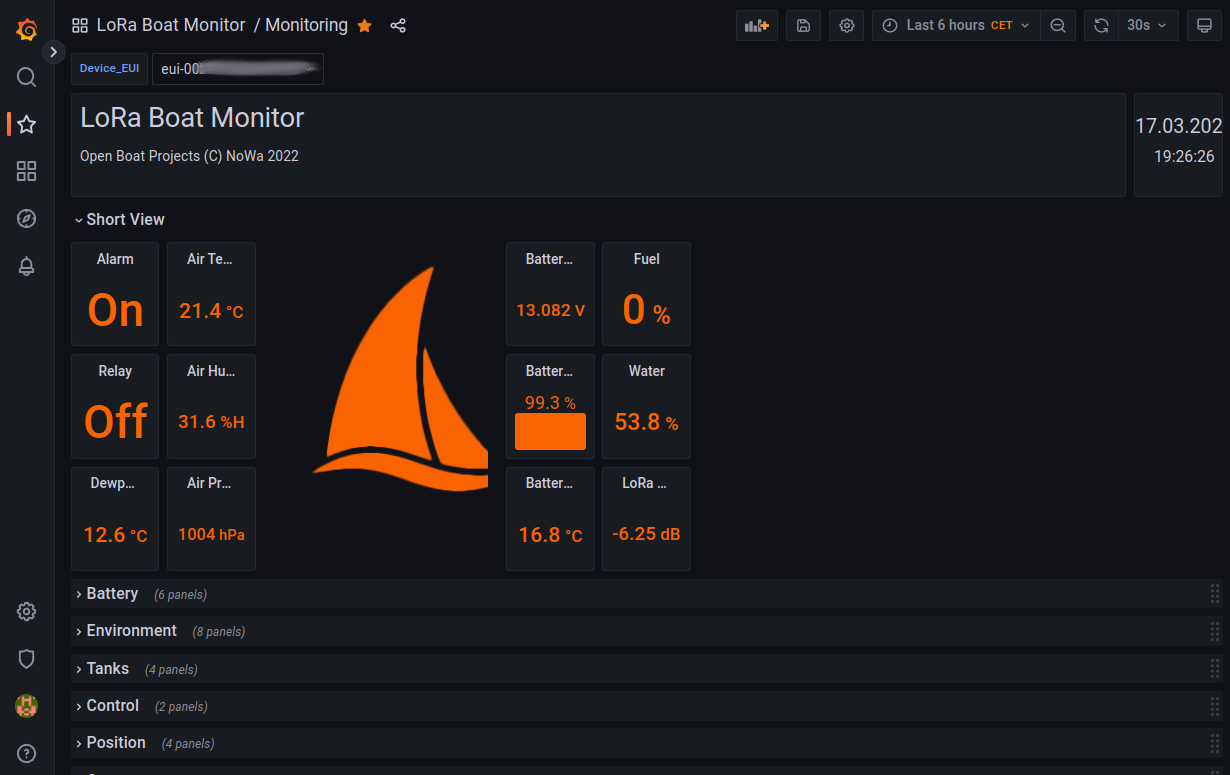
Fig.: Grafana dashboard for the LoRa boat monitor
In order to see the data of your LoRa boat monitor, you have to go to the upper left under Device_EUI enter the Device EUI of your device. This information can be found at TTN V3 End devices in the Applications.

Fig. Device EUI
If you don't want to enter the device EUI every time, create a bookmark in your web browser that is structured as follows. Change the Device EUI to your value. So you always have easy access to your data from the LoRa boat monitor.
https://norbert-walter.dnshome.de/d/vZPaGIK4z/boat-monitoring?orgId=8&refresh=30s&var-Device_EUI=eu-0123456789012345&from=now-6h&to=now
demo system
To get an overview of the functionality offered by Grafana, you can do this Demo system with live data of a LoRa boat monitor. You can register with the following data:
Username: guest
Password: loragast
presentation of the information
The Grafana dashboard is divided into different areas. The following information can be called up in this way:
- quick overview
- battery information
- environmental data
- tank levels
- States of the alarm input and the relay
- position data
- Live camera image from a web camera
- Information on LoRa data transmission
In addition to numerical values, diagrams with time progressions can also be displayed.
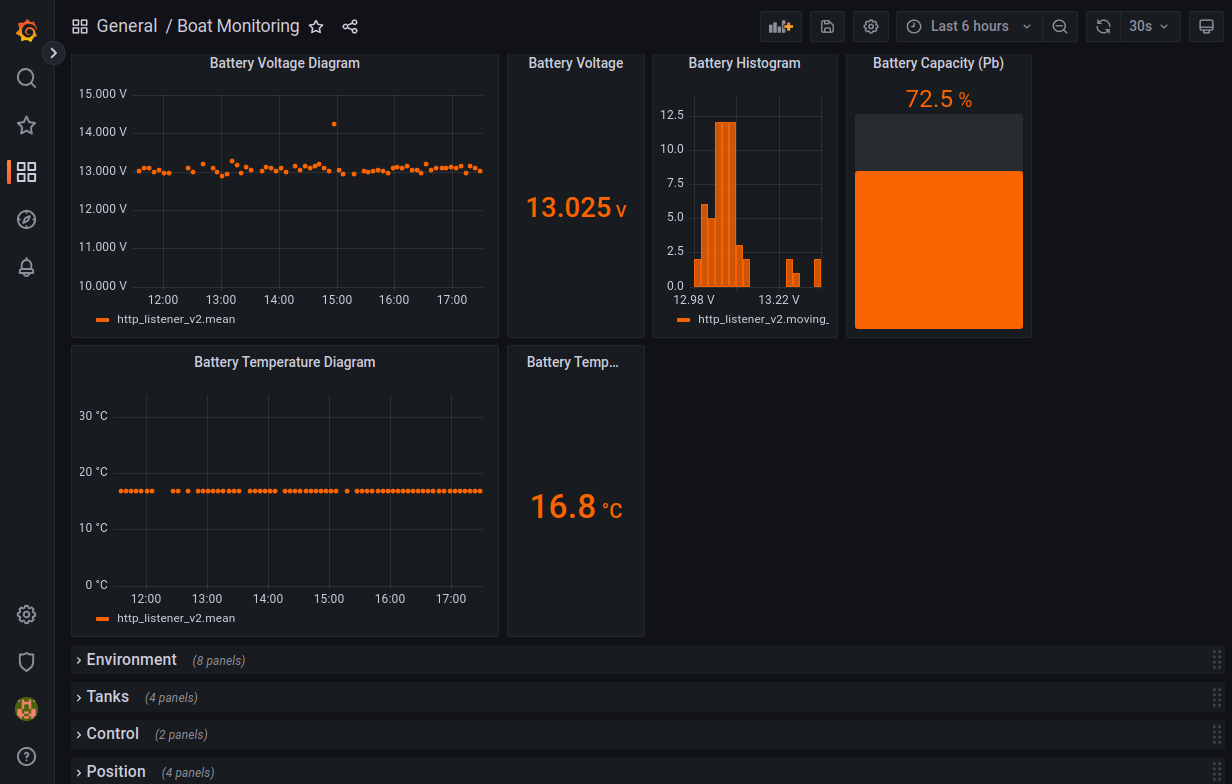
Fig.: Battery information
Location coordinates can be displayed on a map and the course of a route can be displayed historically over different periods of time.
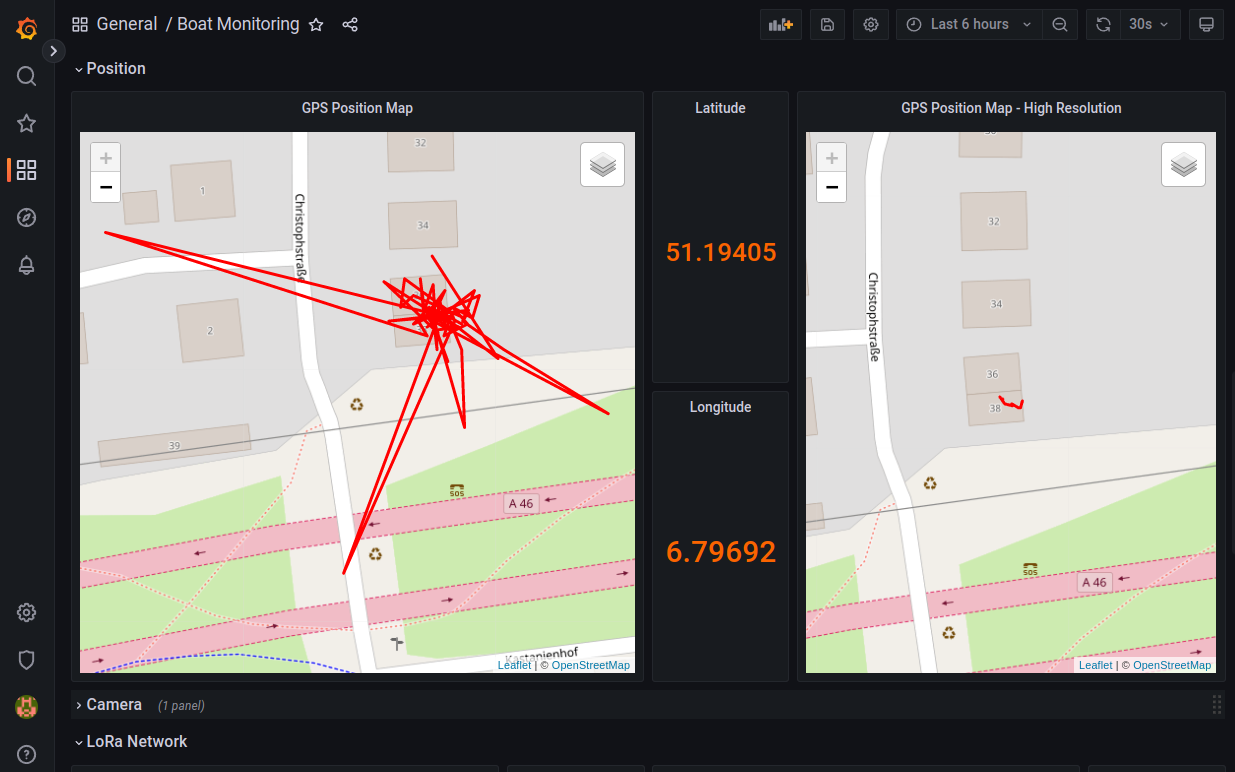
Fig.: Position data
It is also possible to watch the boat via a web camera if you have access to an internet-enabled camera. In order for this to work, the video stream must be available unencrypted on the Internet via a URL.
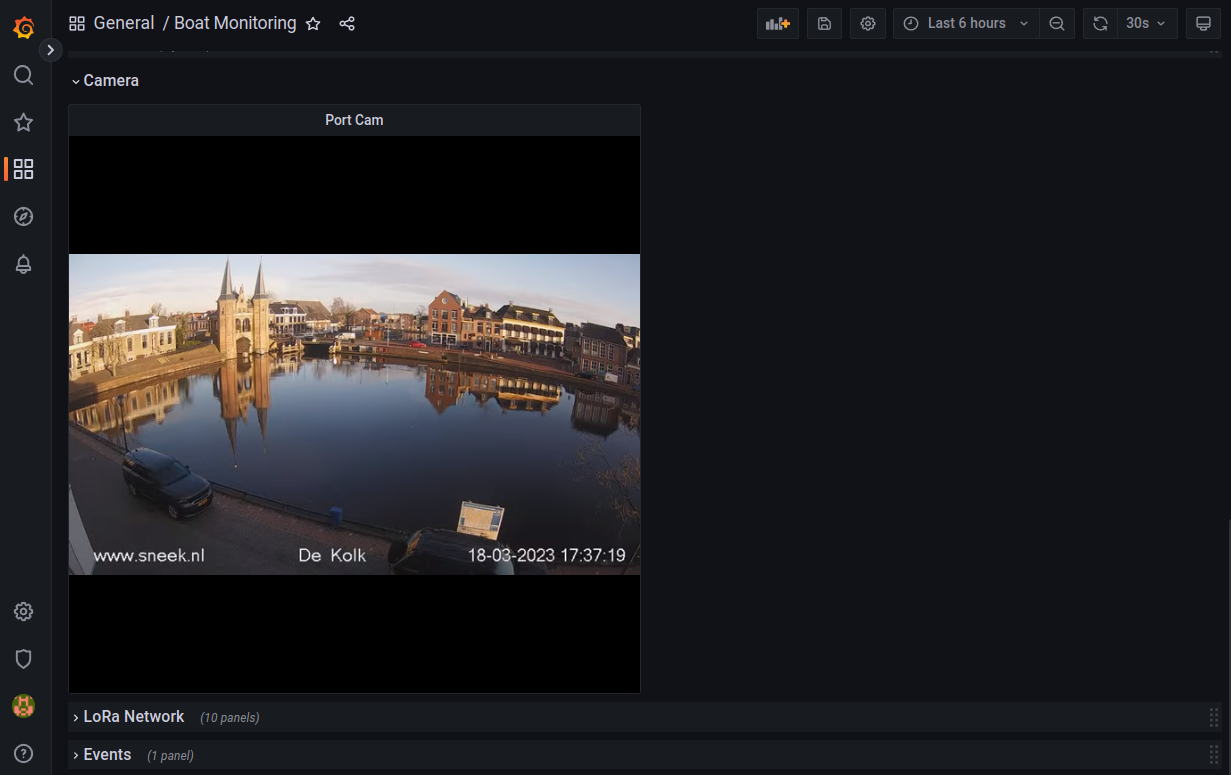
Fig. Live video stream
Information on the quality of the LoRa data transmission is also recorded. This can be used to localize some communication problems. The Rreceived Ssignal Sstrength Indicator (RSSI) is an indicator for the reception field strength of wireless communication applications. The SNR is that signal to noise ratio (English: signal to noise ratio) and indicates the strength of the signal relative to the background noise.
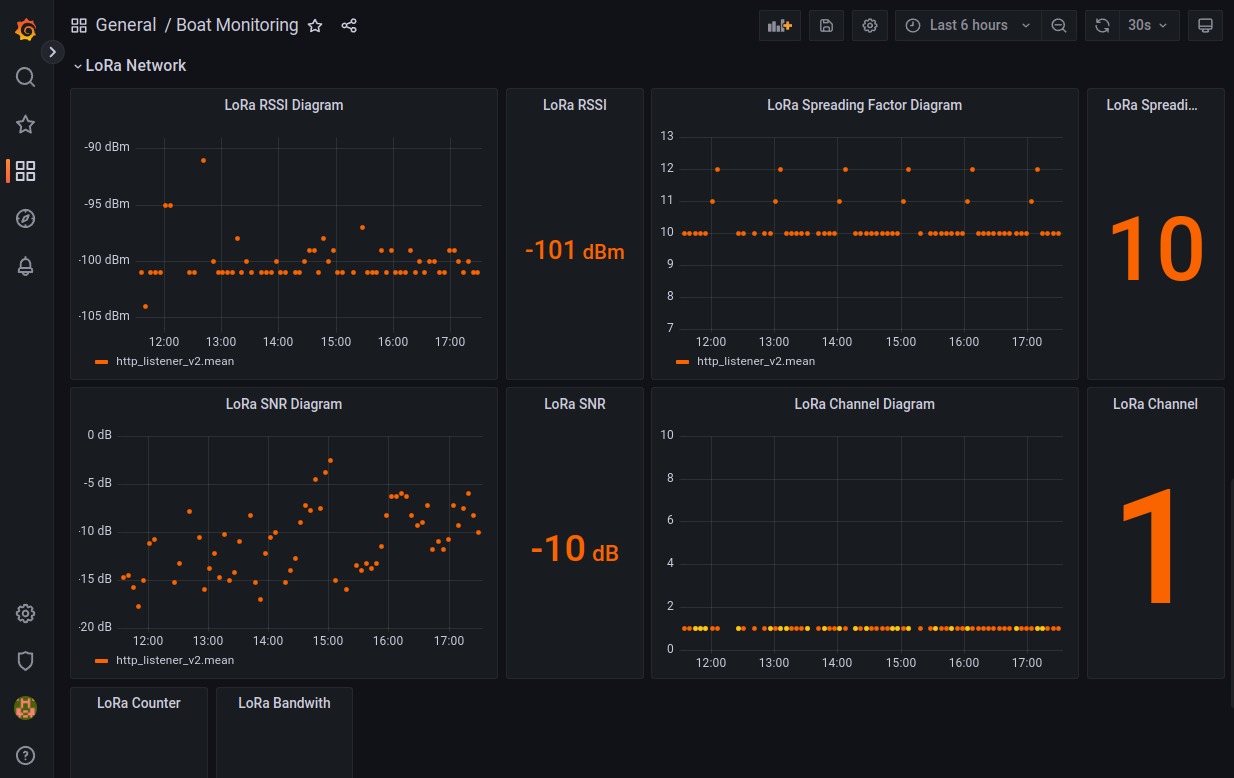
Fig.: Information on LoRa data transmission
In the upper area you will find controls on the right with which you can change the time base and the update rates.

Fig. Controls
share information with others
If you wish, you can share all of the information on Grafana with other people. Then use the link below and customize yours Device EUI accordingly.
https://norbert-walter.dnshome.de/d/vZPaGIK4z/boat-monitoring?orgId=8&refresh=30s&var-Device_EUI=eu-0123456789012345&from=now-6h&to=now&kiosk
On the other hand, if you only want to share your current position on a map with others, use this link:
https://norbert-walter.dnshome.de/d/vZPaGIK4z/boat-monitoring?orgId=8&refresh=30s&var-Device_EUI=eu-0123456789012345&from=now-6h&to=now&viewPanel=81&kiosk
The location history for the last 6 hours is displayed. Then send the links to your friends via email or messenger service. Please note, however, that the link is permanently valid and can be used without a time limit.
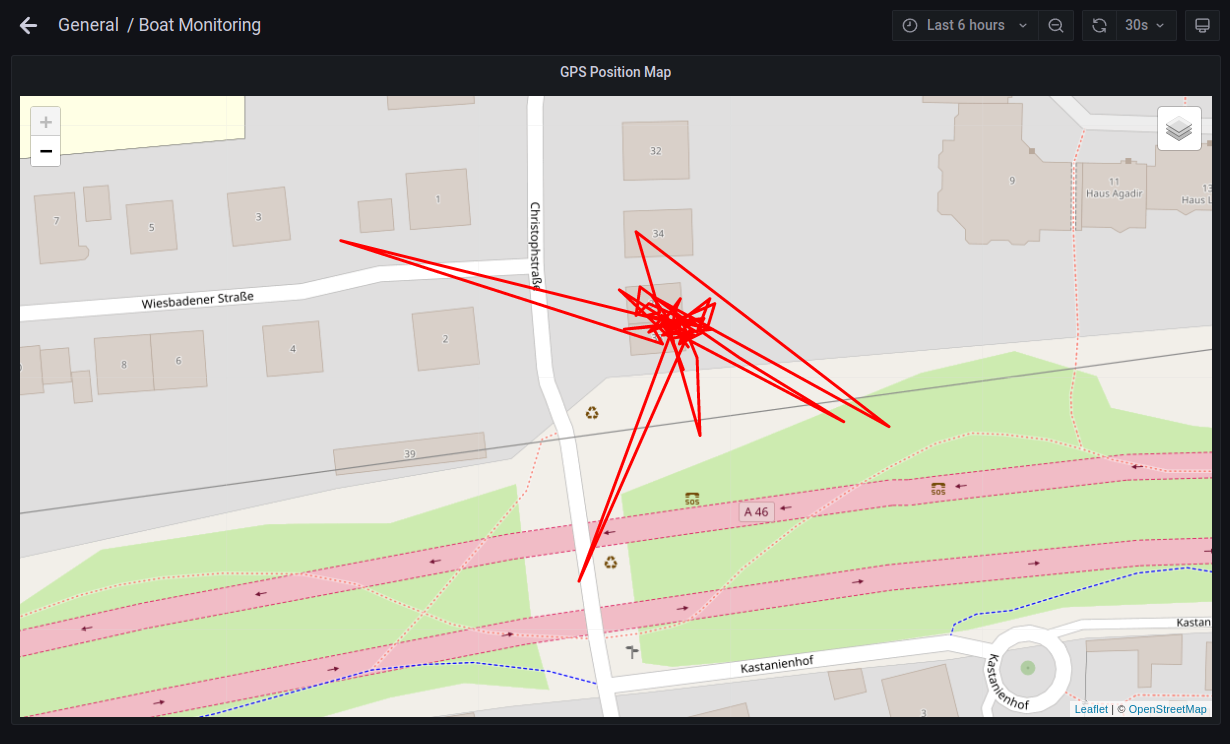
Fig.: Sharing a position with others
Change pages yourself and set up notifications
If you prefer an individual design of the Grafana pages with notifications in the event of limit violations, you can contact us via the contact form notify. We will then set up your own area in Grafana in which you have write access and can create your own pages.
donations
The provision of server services is free for users. However, the operation is associated with costs. These mainly include the hardware acquisition costs and ongoing electricity and internet costs for the server. The server services are currently installed on a Dell micro PC in a Docker environment under TrueNAS Scale. The server is based in Germany and is permanently connected to the Internet via DSL access. There is currently no backup strategy for data in the event of a power failure or disruption. Therefore, back up the data at regular intervals. In the case of higher usage, we want to move the server services directly to the Internet to a provider in the future and also set up a sensible backup solution. Please note that we cannot assume any liability for your data or any damage caused by unusability.
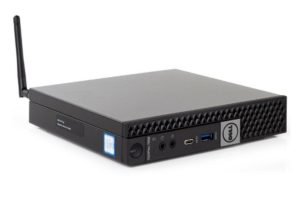
Fig. Dell Optiplex 7040 i5-6600T 2.7G Hz, 16 GB RAM, 128 GB SSD, 4x USB3.1, 2x HDMI, WiFi, 15W
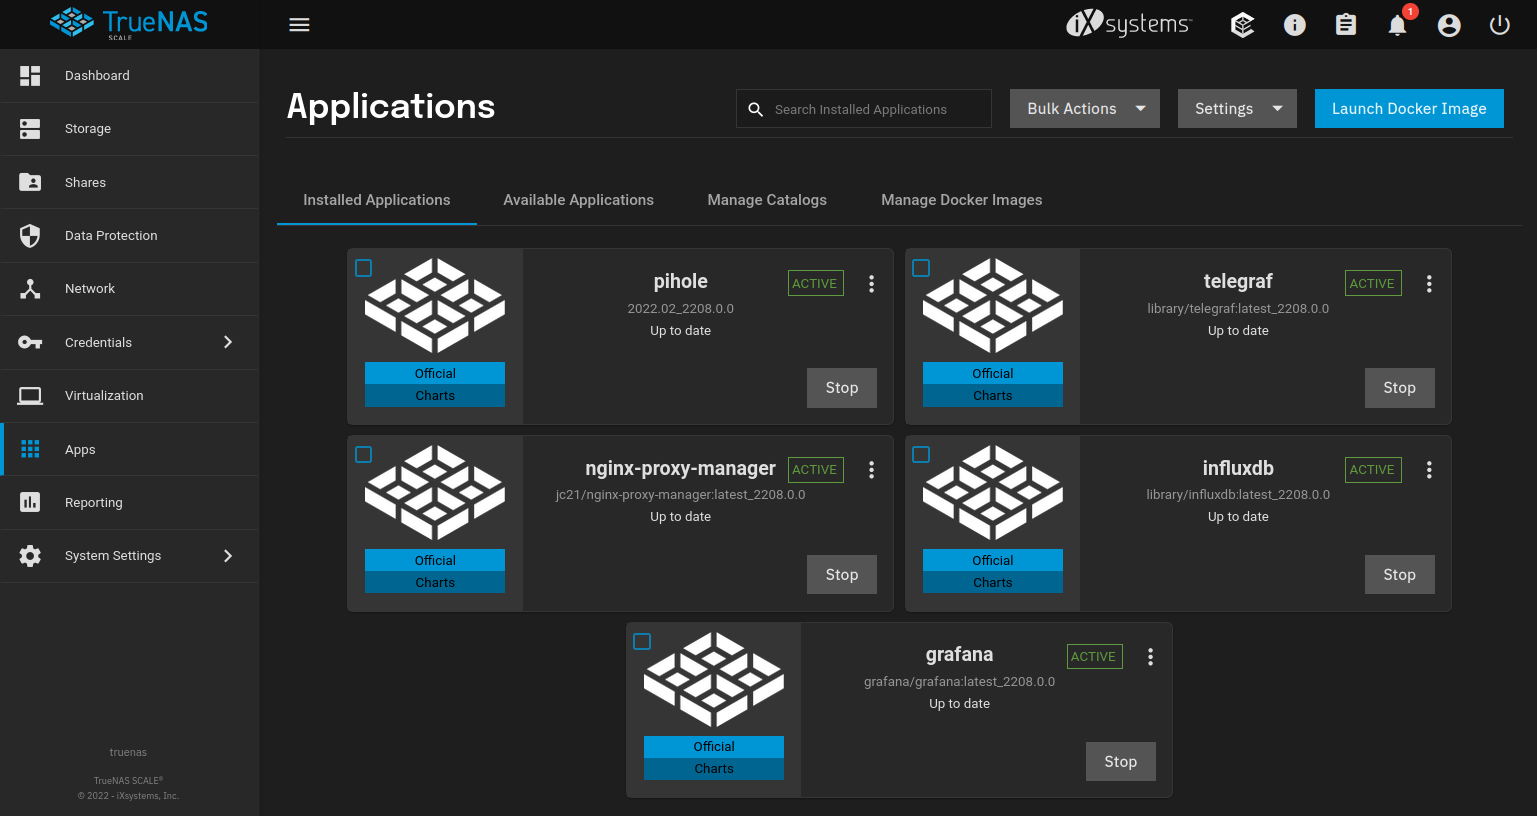
Fig.: TrueNAS Scale
If you use the service regularly and find it useful, we would appreciate a regular small donation. This enables us to make the service permanently available to the general public.
![]()